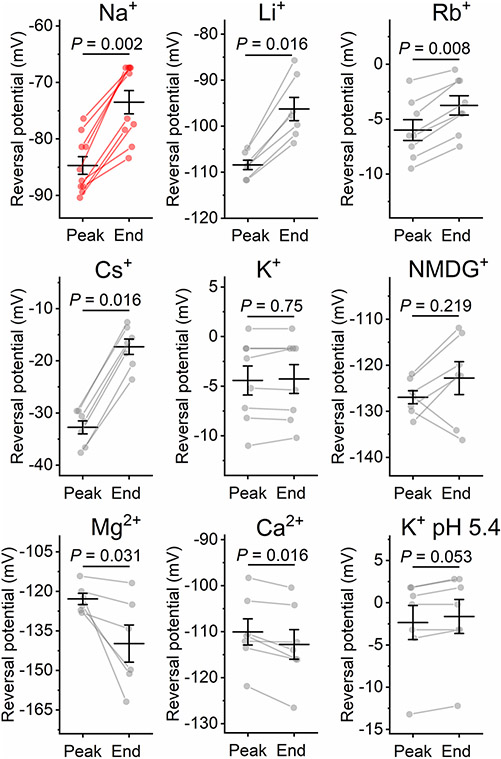
Extended Data Fig. 4 ∣. Comparison of the Vrev values of HcKCR1 photocurrents measured at the time of the peak and at the end of a 1-s light pulse.
The photocurrents were recorded with 130 mM KCl in the pipette and 130 mM of the indicated cation in the bath. The symbols are the data from individual cells, the lines are the mean ± sem, n = 10 cells for Na+, 7 cells for Li+, Cs+, NMDG+, Ca2+, K+ pH 5.4, 6 cells for Mg2+, and 8 cells for K+ pH 7.4 and Rb+. P values were determined by two-sided paired sample Wilcoxon signed ranks test. Source data are provided.

