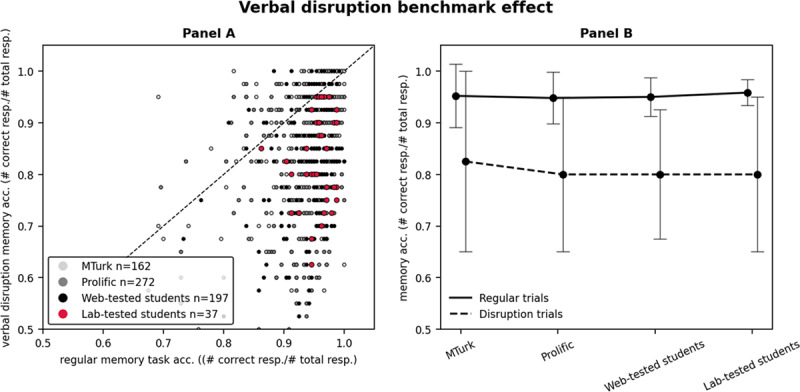
Figure 3.

Verbal disruption benchmark effect.
Note: Panel A x-axis indicates the regular memory accuracy for each data pattern. The y-axis indicates the verbal disruption memory accuracy. Patterns below the diagonal line present the verbal disruption benchmark effect. Panel B contains the participant pools on the x-axis. The black lines show median memory accuracy on regular and verbal disruption trials, for patterns that showed this effect. The error bars are the interquartile range, to give an indication of the middle range of performance for regular and verbal disruption trials.
