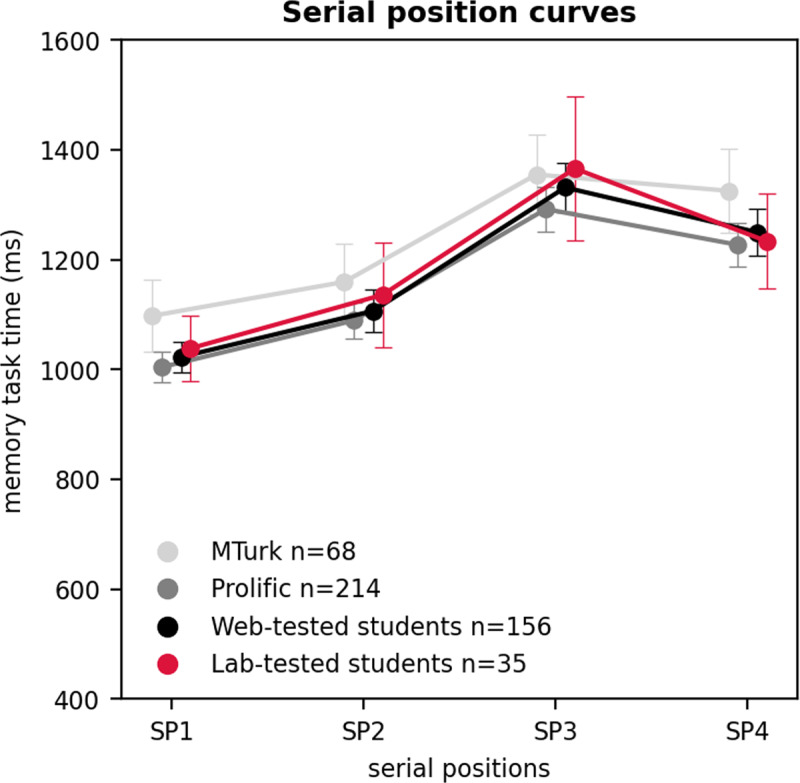
Figure 4.

The serial position curves in MTurk participants, Prolific participants, web-tested students, and lab-tested students.
Note: The serial position curves are calculated on the remaining data patterns that showed a primacy effect (median RT first presented letter memory series < average median RT other letters). On the x-axis we plotted the serial positions (SP), which correspond to the place that a memory probe had in the memory list. On the y-axis we plotted the average of the median memory RT of all patterns for each participant pool. The pattern medians were calculated using trials where the probe was present in the memory list, and for which participants correctly responded. Error bars represent a 95% confidence interval around the mean.
