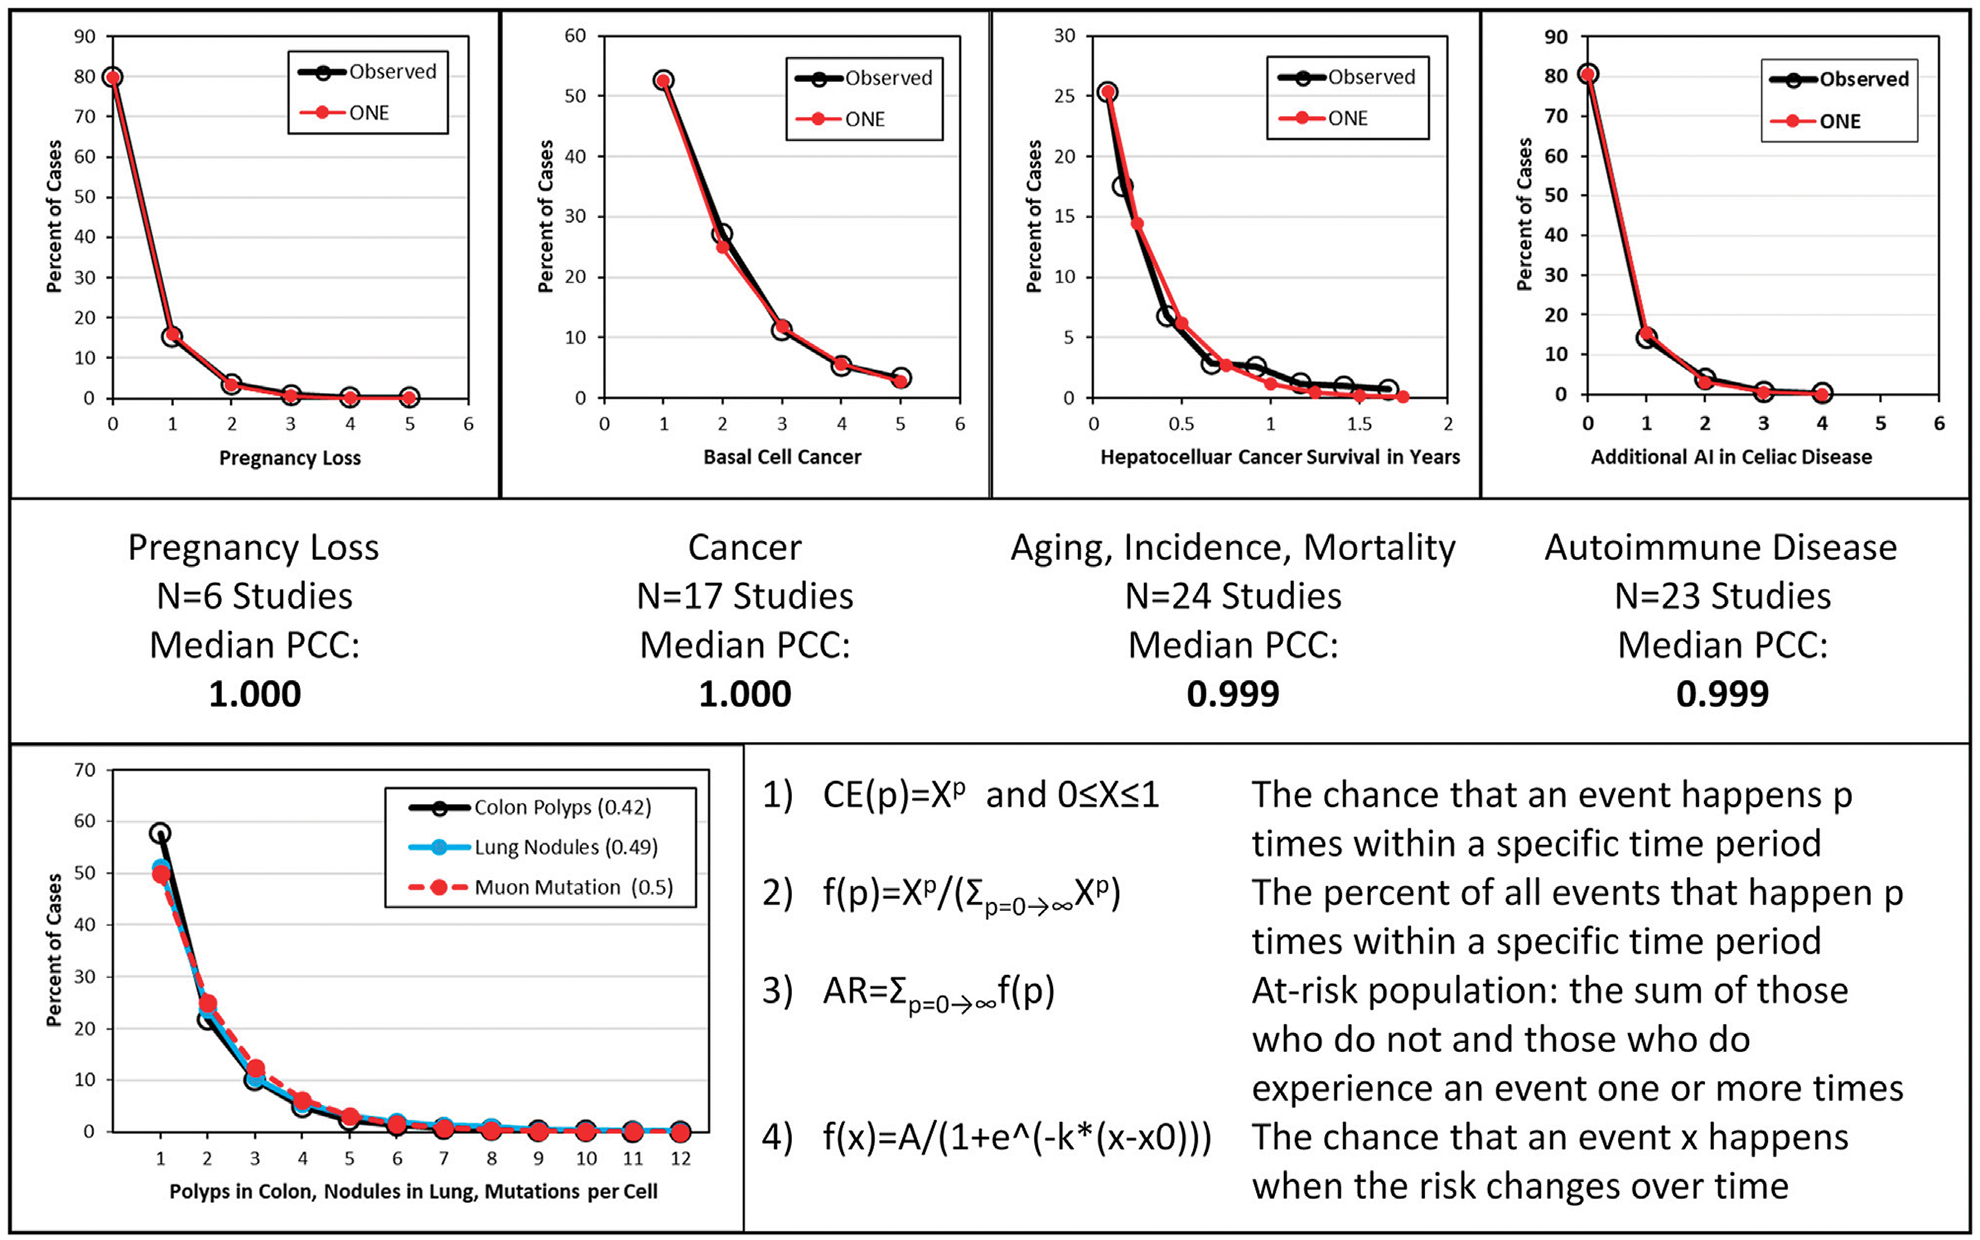
FIGURE 1.

Examples representing 70 studies, the associated Pearson correlation coefficients, a comparison of polyp, lung nodule and estimated muon event distributions and the omnipresent neoplasia equations. (Heuvelmans et al., 2017; Xirasagar et al., 2020; de Groen, 2022c). Top: Examples of distribution of one or more disease events per person. From left to right are shown spontaneous pregnancy loss, cancer, aging, disease incidence and mortality, and autoimmune disease. “Observed” depicts documented data; “ONE” depicts modeled data using omnipresent neoplasia equation 2) derived from colon polyp studies and shown in the bottom panel. Middle: A summary of the type of disease, the number of studies and the median Pearson correlation coefficient (PCC) shown in Top panel. Bottom: Left: Observed colon polyp and lung nodule data in at-risk persons around age 60 and mutations per cell in 0.5 days given 1 muon event/cell/day. Right: omnipresent neoplasia equations (de Groen, 2020a).
