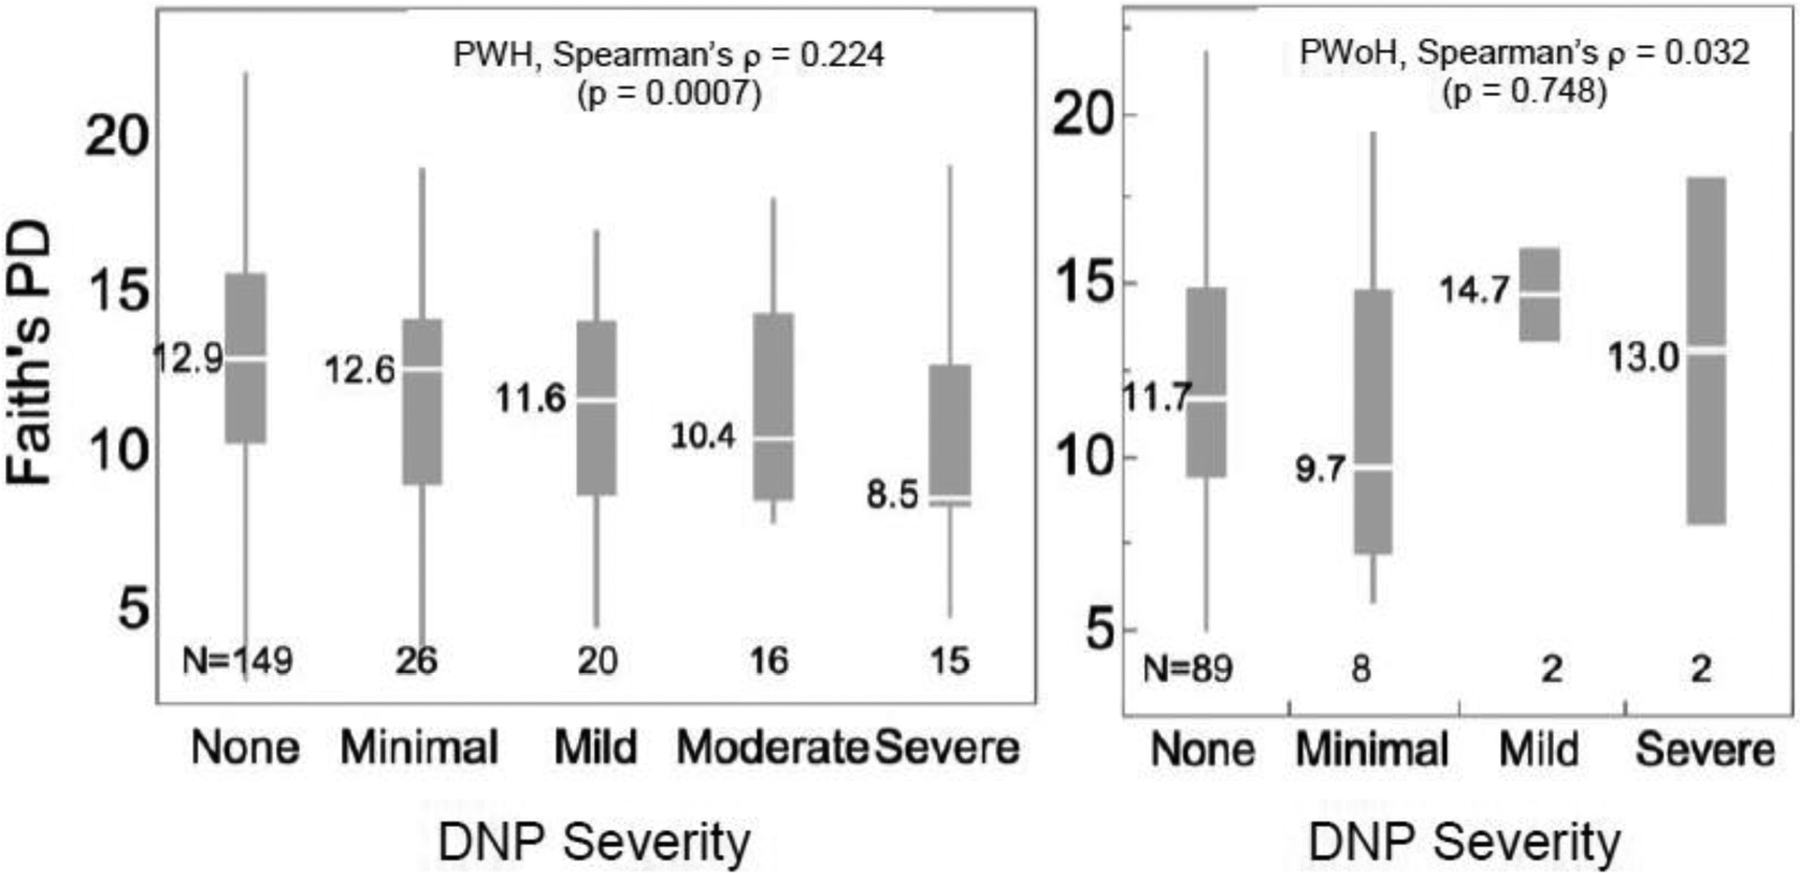
Figure 1.

Among PWH, there was a dose-response relationship such that worse pain was associated with a stepwise reduction in alpha diversity as indexed by Faith’s PD (Spearman’s ρ = 0.224, p = 0.0007). Among PWoH, there was no significant relationship (Spearman’s ρ = 0.032, p = 0.748). Box plots show for each group the median (central white line), 25th and 75th percentiles (box) and 5th and 95th percentiles (whiskers). Values to the left of each box plot are the medians.
