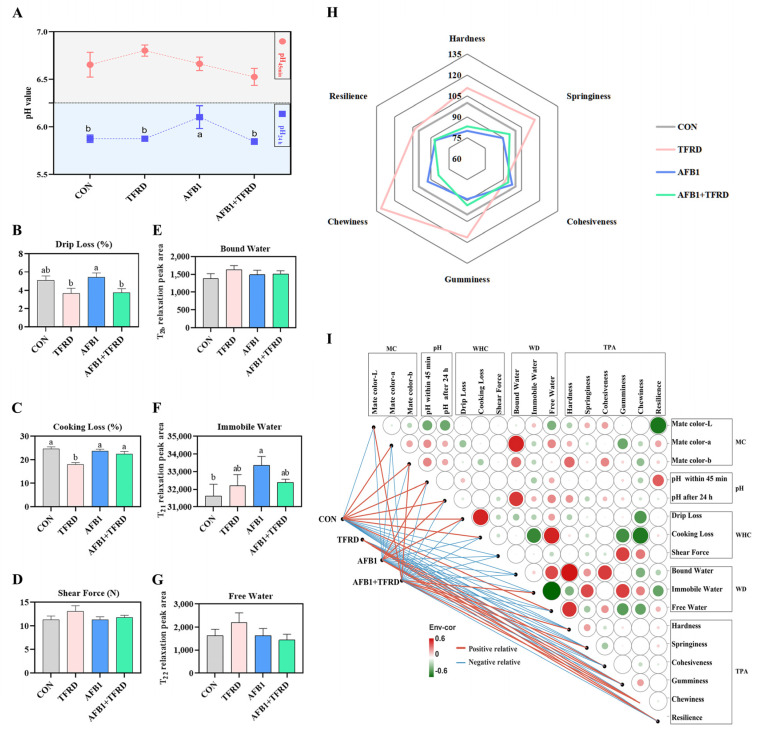
Figure 2.
Effect of TFRD on AFB1−induced meat quality of the breast muscle in broilers. (A) Comparison of pH value of the breast muscle in the CON, TFRD, AFB1, and AFB1 + TFRD groups during the entire experimental period. (B–D) Comparison drip loss, cooking loss, and shear force of the breast muscle in the CON, TFRD, AFB1, and AFB1 + TFRD groups. (E–G) Comparison of water distribution including bound water, immobile water, and free water of the breast muscle in the CON, TFRD, AFB1, and AFB1 + TFRD groups. (H) Comparison of texture profile analysis including hardness, springiness, cohesiveness, gumminess, chewiness, and resilience of the breast muscle in the CON, TFRD, AFB1, and AFB1 + TFRD groups. (I) Pearson correlation analysis between meat quality assessment indicators. Note: The different rectangles are colored based on the Pearson correlation coefficients between meat quality assessment indicators. The intensity of color represents the degree of correlation, green represents positive correlation, red represents negative correlation. The edges indicate the correlation between breast muscle ratios and the meat quality assessment index, red for the positive correlation and blue for the negative correlation. MC: meta color, WHC: water-holding capacity, WD: water distribution, TPA: texture profile analysis. Different letters indicate statistically significant differences (p < 0.05), and all values are presented as the means ± SD, one−way ANOVA.

