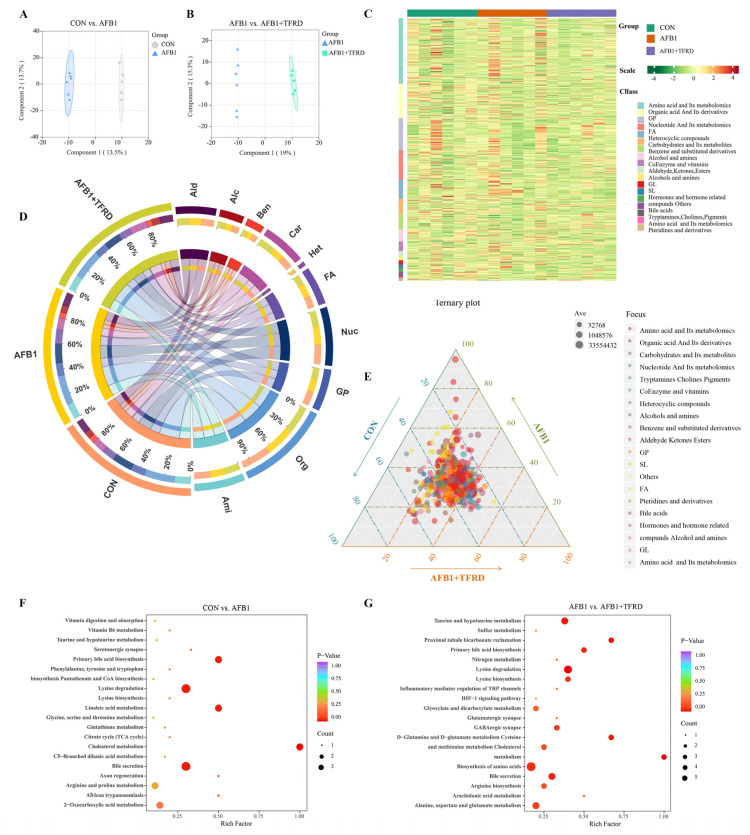
Figure 3.
Analysis of breast muscle metabolism after TFRD treatment in AFB1-exposed chickens. (A,B) OPLS-DA analysis of LC-MS/MS of broiler breast muscles, CON vs. AFB1 and AFB1 vs. AFB1 + TFRD. (C) Cluster analysis of LC-MS/MS of broiler breast muscles. (D) Metabolite abundance analysis of LC-MS/MS of broiler breast muscles. Ami, amino acid and its metabolomics; Org, organic acid and its metabolomics; GP, glycerol phospholipids; Nuc, nucleotide and its metabolomics; FA, fatty acid; Het, heterocyclic compounds; Car, carbohydrates and its metabolomics; Ben, benzene and substituted; Alc, alcohol and amines; Ald: aldehyde, ketones, esters. (E) Ternary analysis of LC-MS/MS of broiler breast muscles. The degree of concentration of the points indicates that the metabolites are evenly distributed among the three groups. The degree of dispersion of the points indicates that the metabolites differ significantly among the three groups. (F,G) Potential metabolic pathway analysis based on significantly differential metabolites in breast muscles from the CON, AFB1, and AFB1 + TFRD group broiler chickens. The degree of enrichment was analyzed by a rich factor, p-value, and the number of metabolites that were enriched in each pathway. The size of the bubble indicates the number of significant differential metabolites that are enriched in this pathway, and the point with the different gradation of color (from red to blue) represents the scope of the p-value. The larger size of each circle indicates a higher degree of enrichment, and the lower p-value represents a more significant degree of enrichment.

