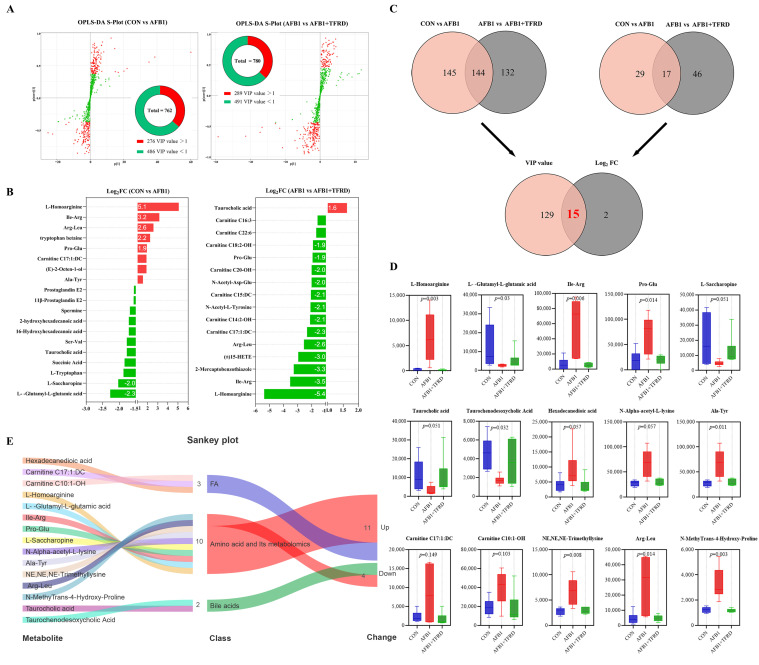
Figure 4.
Screening of significantly differential metabolites in breast muscles after TFRD treatment in AFB1-exposed chickens by metabolomics analysis. (A) S-plot of OPLS-DA analysis of breast muscle metabolites. Significantly differential metabolites (VIP > 1) are noted as a red dot, whereas a green dot represents no significant difference in metabolites. The number of metabolites that meet the criteria (VIP > 1) is shown in a pie chart. (B) Visualization of log2-transformed read counts of differential metabolites in breast muscles between the CON vs. AFB1 and AFB1 vs. AFB1 + TFRD groups (|log2FC| ≥ ±1.5, FC stands for fold-change). (C) Venn analysis was performed by |log2FC| ≥ ±1 and VIP > 1 to screen for differential breast muscle metabolites. The overlap of the Venn diagram represents the number of differential breast muscle metabolites common to the different comparison groups. (D) The overlap of VIP values and log2(FC) in the Venn diagram indicates the number of differential metabolites shared between groups. Statistical analysis was performed for metabolites that differed between groups; p < 0.05 indicates statistical significance between the two variables, and all values are expressed as mean ± SD with one-way ANOVA. (E) Sankey plots depict the class and trends of marker differential metabolites in the AFB1 group of breast muscles.

