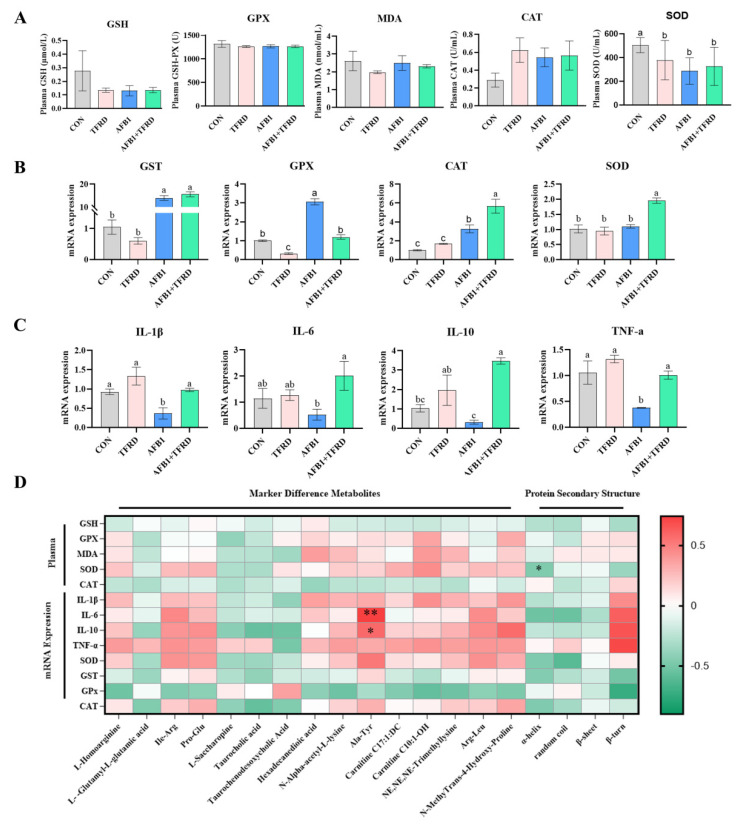
Figure 6.
Effect of TFRD on AFB1-induced oxidative stress and inflammatory damage of the breast muscle in broilers. (A) Plasma antioxidant enzyme levels, including GSH, GPX, CAT, T-SOD, and MDA. (B) The relative mRNA expressions of oxidative stress-related genes SOD, GST, GPX, and CAT. (C) The relative mRNA expressions of inflammation-related genes IL-1β, IL-6, IL-10, and TNF-ɑ. (D) Pearson correlation analysis between indicators related to oxidative stress and inflammatory response with the significantly differential metabolites and the protein secondary structure of myofibrillar in breast muscle. Note: The different rectangles are colored based on the Pearson correlation coefficients between meat quality assessment indicators. The intensity of color represents the degree of correlation, green represents positive correlation, red represents negative correlation. The asterisks indicate statistically significant differences and correspond to p < 0.05 (*) and p < 0.01 (**). Different letters indicate statistically significant differences (p < 0.05), p-value higher than 0.05 represents not statistically significant.

