Figure 1.
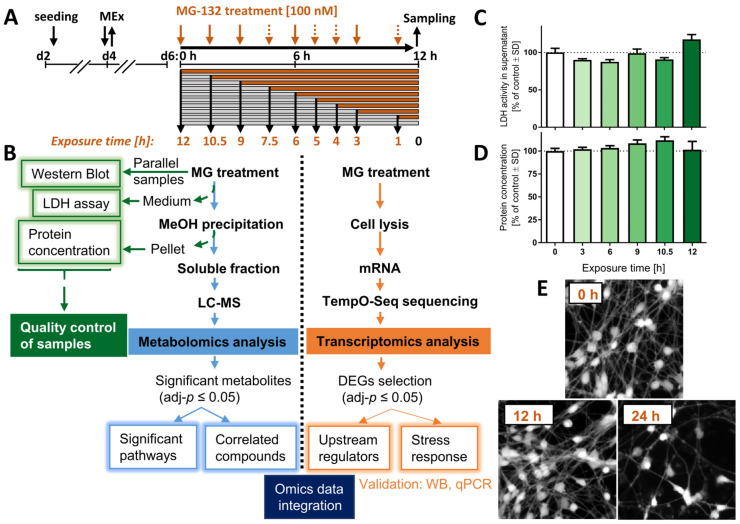
Experimental workflow and sample validation. LUHMES neurons were exposed to the proteasome inhibitor MG-132 (MG) for various times before samples were prepared. (A) Culture and treatment scheme: pre-differentiated LUHMES cells (d2) were plated, and medium was exchanged on d4 (MEx). At the stage of mature neurons (d6), cell cultures were treated with 100 nM MG for 1–12 h. Orange arrows indicate the time of treatment initiation in a reversed order. Dashed arrows: sampling time points only for the transcriptomics, but not metabolomics profiling. (B) Flow diagram of the experiment, including quality control assays (left), the metabolomics pipeline (middle) and of the transcriptomics procedure (right). (C) The cell viability was assessed by the lactate dehydrogenase (LDH) release assay. Cell supernatants were obtained from the same wells that were used for the metabolomics analysis. The activity of LDH in the medium was normalized to the one measured above untreated cells. (D) The protein content was measured from the pellet obtained by methanol (MeOH) precipitation during the preparation of the metabolomics samples. (E) LUHMES cells, treated with MG for 0, 12 and 24 h MG were stained with calcein-AM, and representative pictures are shown. Data shown in graphs are means ± SD of independent replicates. For MG treatments, 3 different samples were analyzed. For controls (DMSO), 4 replicates were prepared to provide for more robust baseline data. DEG, differentially expressed gene; LC-MS, liquid chromatography–mass spectrometry; MG, proteasome inhibitor MG-132.

