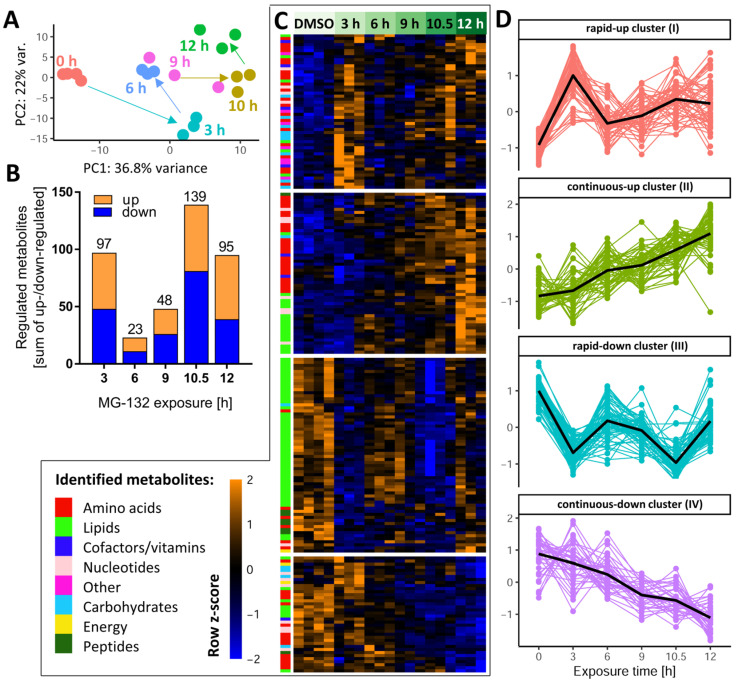
Figure 3.
Dynamics of the MG-132-induced metabolic changes over time. Altogether, 386 cellular metabolites were quantifiable under the control condition. Based on LIMMA statistics, 206 of these metabolites were changed significantly at least at one time point by MG-132 treatment. A high-level overview of these metabolome changes is given here. (A) Principal component analysis (PCA) of all changed metabolites: the first two dimensions are plotted, with each analyzed sample displayed as filled circle (color-coded according to the sampling time). The axes were scaled according to the variance covered by the principal components (PCs). (B) The absolute numbers of metabolite changes for each exposure time are displayed on top of the bars. The colored segments indicate the numbers for the two directions of regulation: up (orange) and down (blue). (C) Unsupervised clustering of metabolite time-profiles. The heat map colors represent the z-scores of the row-wise normalized relative levels for each metabolite. All replicates and conditions are shown. A color code was used to visualize the major biochemical groupings (e.g., lipids, nucleotides) of the metabolites. The clustering dendrogram is not shown, but the four major clusters are indicated by white separating lines. (D) For each of the clusters, the time profiles of their associated metabolites are given. Clusters are named by the average time profile of their constituents (e.g., rapid-up or continuous-down). The metabolite z-score values were averaged per treatment condition in each cluster and are shown as black lines. Metabolites were considered to be regulated if the false discovery rate–corrected p-value for at least one time point was ≤0.05. DMSO, dimethyl sulfoxide.

