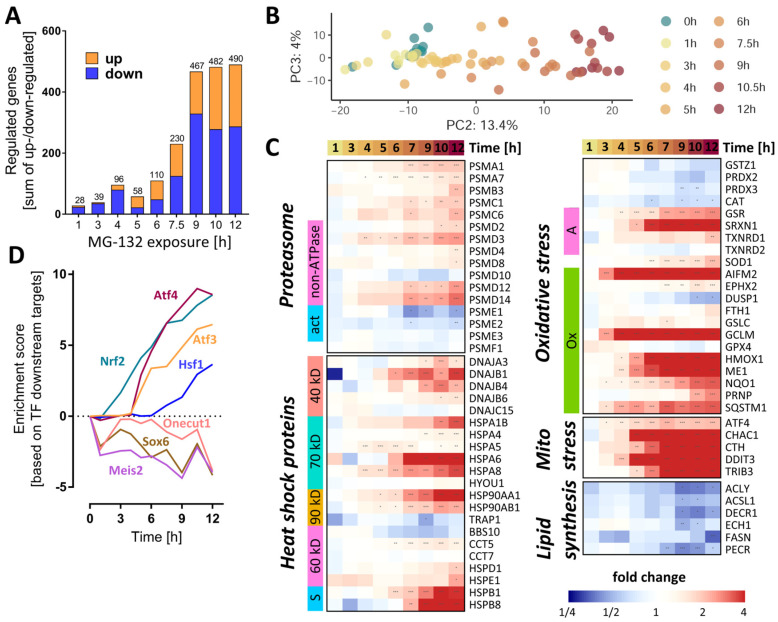
Figure 4.
Dynamics of the MG-132-induced transcriptomic changes over time. Transcriptome data were obtained from LUHMES cells treated with MG-132 (100 nM) for 1–12 h, as outlined in Figure 1. Significant transcriptomic changes were identified by performing a differential gene expression analysis for each MG exposure time relative to the DMSO control. As output metrics, we provide the average log2 fold changes for each of the transcripts, including the standard deviation, and the statistical significance of the change. (A) Principal component analysis (PCA) second and third dimensions are displayed, scaled according to the variances covered. The first dimension captured mostly background noise and was, therefore, not considered. Each dot represents a time point (label) based on data from averaged replicates. (B) The absolute numbers of differentially expressed genes per exposure time are displayed. The two bar sections indicate the numbers for the two directions of regulation: up (orange) and down (blue). (C) The heat map shows the measured changes in transcript abundance (log2 fold changes) for members of the heat shock protein family (40/60/70/90 kD, types of heat shock proteins based on their molecular weights, s, small chaperones;), proteasome subunits (ATP, ATPase subunits; α/β, components of the α/β proteasome rings making up the 20S core proteasome; act, proteasome activators; i, proteasome inhibitors), oxidative stress responsive genes (A, other antioxidants; G, glutathione peroxidases; Op, other peroxidases; Ox, oxidative stress responsive genes; P, peroxiredoxins; S, superoxide dismutases) and lipid synthesis pathways. (D) Overrepresentation analysis of binding sites for transcription factors on MG-132-regulated genes: protein activity predictions were made for each individual time point for master regulators (DoRothEA database regulons). A subset of perturbed transcription factors is shown. The enrichment scores are row-wise normalized to display more clearly the time profile of their effect on the transcriptome. The results of the full collection of regulators analyzed are displayed in Supplementary Figure S10. Additionally, Table S2 contains further information about these DEGs (full gene names and enzyme identifiers). Transcriptomics samples were prepared separately and treated as statistically independent (biological replicates). For each condition, 6 samples were produced and measured. * adjusted-p < 0.05; ** adjusted-p < 0.01; *** adjusted-p < 0.001; MG, proteasome inhibitor MG-132.

