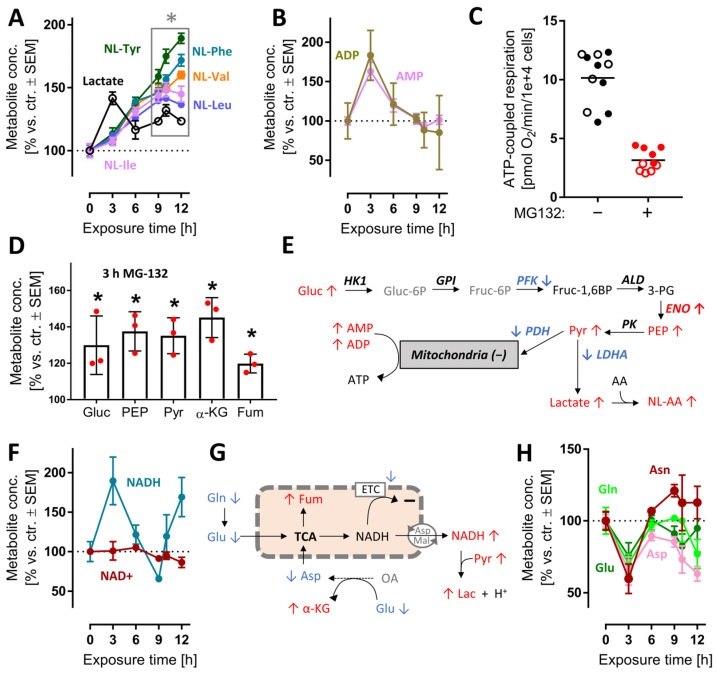
Figure 5.
Early perturbation of neuronal energy metabolism after MG-132 treatment. Metabolome and transcriptome samples were obtained as detailed in Figure 1. Data on relative levels of metabolites were extracted from the metabolome data matrix (Figure 1 and Figure S4). (A,B) Time-dependent changes of lactate, N-lactoyl amino acids (NL-AA), ADP and AMP. (C) Data on ATP-coupled respiration were obtained as derivative measure of the overall oxygen consumption rate at 6 h after MG treatment. Filled and empty circles belong to 2 completely separate experiments, each with at least 5 independent replicates. (D) Changes of metabolites related to mitochondrial function after 3 h MG. Independent replicates are represented as dots. (E) Scheme of glycolysis with mapped measurements for metabolites (3 h) and transcripts (9 h). Up-regulations are shown in red, down-regulations in blue and unchanged levels in black. (F) Time-dependent changes of nicotinamides. (G) Scheme of mitochondrial metabolism with mapped measurements for metabolites (3 h). (H) Time-dependent changes of energy-related amino acids. A complete set of data for the pathways in (E) is provided in Figure S12. A full overview of captured metabolites is found in Table S1. A full overview of targeted transcripts is provided in Table S2. Data are means ± SEM of independent replicates. For MG-132 treatments, 3 different samples were analyzed. For controls, 4 replicates were prepared to provide for more robust baseline data. * adjusted-p < 0.05; α-KG, α-ketoglutarate; ADP, adenosine diphosphate; AMP, adenosine monophosphate; Fum, fumarate; LDH, lactate dehydrogenase; NAD+, oxidized nicotinamide adenine dinucleotide; NADH, reduced nicotinamide adenine dinucleotide; PDH, pyruvate dehydrogenase; PEP, phosphoenolpyruvate.

