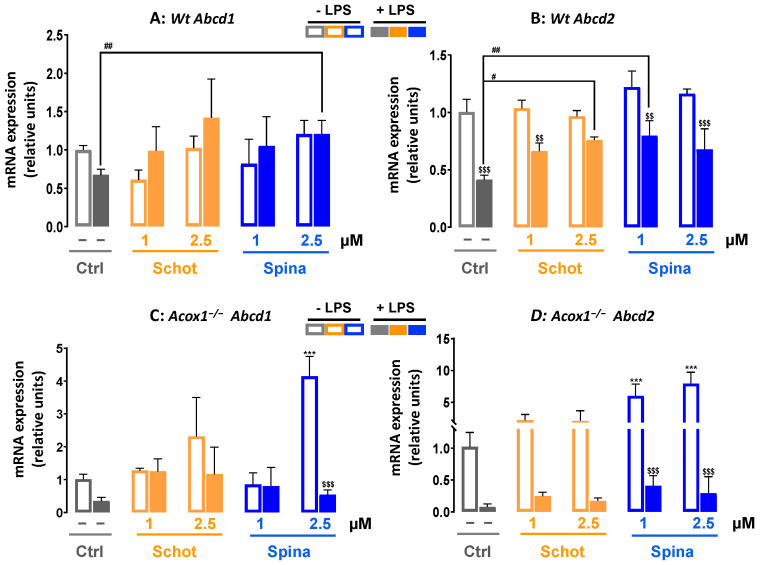
Figure 8.
Effect of Schot or Spina treatment on the gene expression of Abcd1 (A,C) and Abcd2 (B,D) in Wt (A,B) and Acox1−/− (C,D) BV-2 microglial cells. Cells were incubated for 24h with Schot or Spina (1 or 2.5 µM) in the absence or presence of LPS (1 µg/mL). Total RNA was isolated from BV-2 cells, and then the expression level of genes of interest was quantified by real-time RT-qPCR. All values are presented as means ± SD of two independent experiments performed in triplicate, with the statistical significance of the increased mean signal indicated as *** p ≤ 0.001 compared to control; ## p ≤ 0.01 and # p ≤ 0.05 compared to LPS; and $$$ p ≤ 0.001 and $$ p ≤ 0.01 compared to the different treatments with or without LPS administration. Statistical significance was determined using two-way ANOVA followed by Tukey’s test for multiple comparisons.

