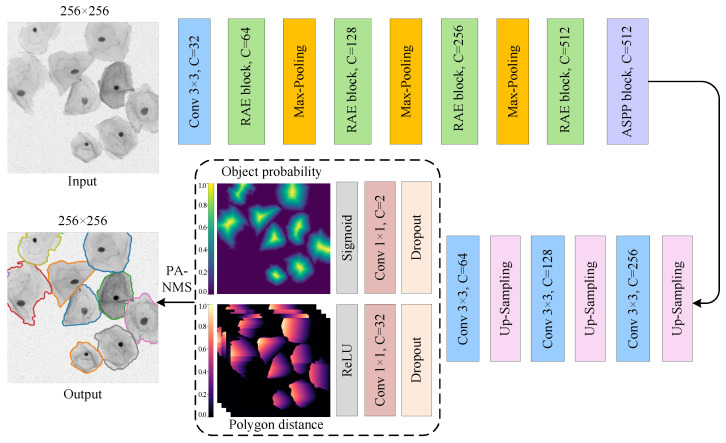
Figure 4.
The overall structure of SPCNet, which adopts an encoder-decoder structure and mainly consists of down-sampling and up-sampling paths. Here, the rectangular bars of different colors represent different functional modules, and C denotes the number of channels in the feature map. In the output image, the cell outlines of different colors indicate the segmented cervical cell instances.

