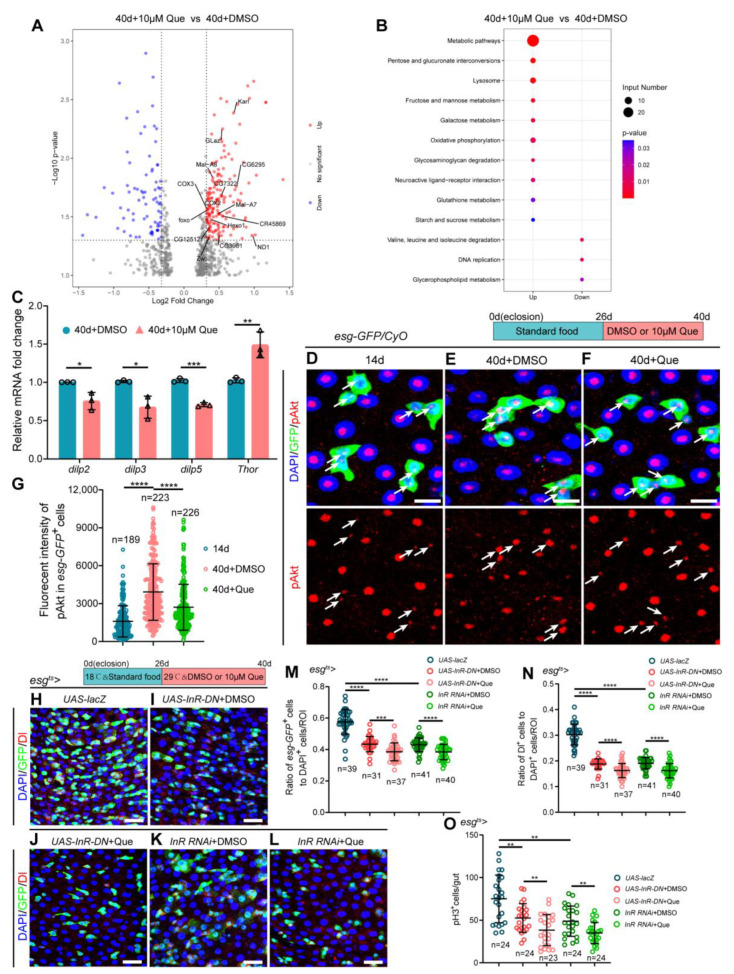
Figure 5.
Que prevents age-related hyperproliferation of ISC by inhibiting insulin signaling. (A) Volcano plot shows differentially expressed genes in Que-treated 40-day-old flies compared to the control group. Red dots indicate significantly upregulated genes, blue dots indicate significantly downregulated genes, and gray dots indicate genes that are not significantly different. Glaz, Karl, and foxo are antioxidant-related genes, and the other identified genes are glucose and lipid metabolism-related. (B) KEGG pathway enrichment analysis of upregulated or downregulated genes in pair-wise comparison of 40-day-old flies without Que supplementation to 40-day-old flies with 10 µM Que supplementation. Both the p-value and input number represent the significance of the respective pathway. (C) RT-qPCR analysis of insulin signaling pathway-related genes (dilp2, dilp3, dilp5, and Thor) in the esg-GFP+ cells of 40-day-old flies fed with or without Que. Three independent experiments were conducted. (D–F) Representative immunofluorescence images of the posterior midguts of 14- (D) and 40-day-old (E) flies without Que supplementation and 40-day-old flies with 10 µM Que supplementation (F) stained with DAPI, GFP, and pAkt (red; a marker indicates activated insulin signaling pathway). White arrows indicate esg-GFP+ cells and pAkt staining. The top panels represent the merged images, whereas the bottom panels represent pAkt. Scale bars represent 10 µm. (G) Quantitation of pAkt fluorescence intensity in esg-GFP+ cells from experiments (D–F). Each dot indicates one esg-GFP+ cell. (H–L) Representative immunofluorescence images of the posterior midguts of flies carrying esgts-Gal4-driven UAS-lacZ (H), UAS-InR-DN + DMSO (I), UAS-InR-DN + Que (J), InR RNAi + DMSO (K), and InR RNAi + Que (L) stained with DAPI, GFP, and Dl. Scale bars represent 25 µm. (M,N) The ratio of esg-GFP+ cells and Dl+ cells to DAPI+ cells per ROI in the posterior midguts of flies in experiments. (H–L). n: number of ROI counted. (O) The number of pH3+ cells in the whole gut of flies in experiments (H–L). n: number of gut counted. Error bars represent SDs. Student’s t-tests, * p < 0.05, ** p < 0.01, *** p < 0.001, and **** p < 0.0001.

