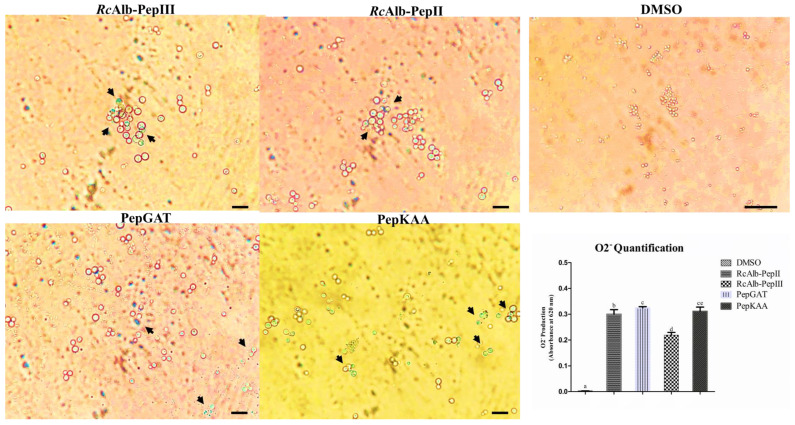
Figure 1.
Qualitative and quantitative analysis of anion superoxide accumulation in C. neoformans. Light microscopy analysis of the conversion of NBT into formazan (blue or cyan dots–black arrows). The panel of DMSO represents the control cells, and other panels are treated C. neoformans cells with synthetic peptides. The inserted graphic represents the quantitative analysis of anion superoxide accumulation in C. neoformans cells. In control bar indicates 100 µm. In treated cells bar indicate 50 µm. The different lowercase letters indicate statistical significance at p > 0.05.

