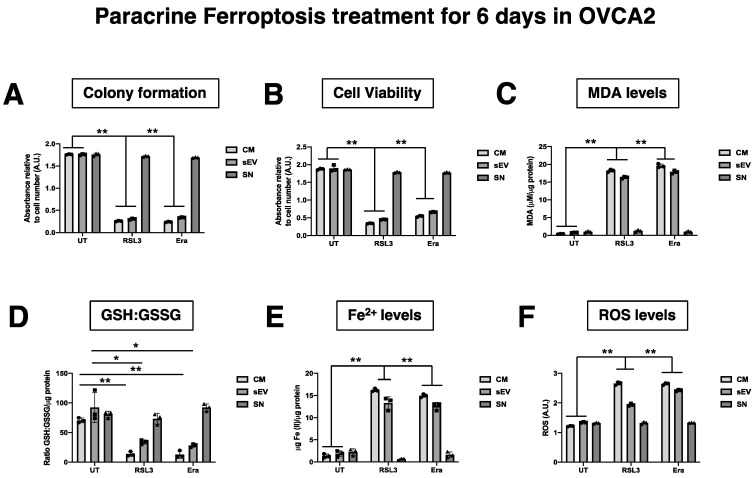
Figure A3.
Analysis of ferroptosis paracrine in F-OVCAc treated with CM, sEV and SN for 3 days. (A) Histogram of colony formation in OVCAc treated with CM, SN or sEV from F-OVCAc for 6 days in OVCA2; (B) Histogram of cell viability by MTT assay in OVCAc treated with CM, SN or sEV from F-OVCAc for 6 days in OVCA2; (C) Histogram of Malondialdehyde (MDA) levels in OVCAc treated with CM, SN or sEV from F-OVCAc for 6 days in OVCA2; (D) Histogram of ratio GSH/GSSG (Reduced Glutathione/Oxidized Glutathione) levels in OVCAc treated with CM, SN or sEV from F-OVCAc for 6 days in OVCA2; (E) Histogram of Iron (II) (Fe2+) levels in OVCAc treated with CM, SN or sEV from F-OVCAc for 6 days in OVCA2; (F) Histogram of reactive oxygen species (ROS) levels in OVCA treated with CM, SN or sEV from F-OVCAc for 6 days in OVCA2. The graphs show the mean ± SD of three independent experiments. * p < 0.05 and ** p < 0.01. Related to Figure 6.

