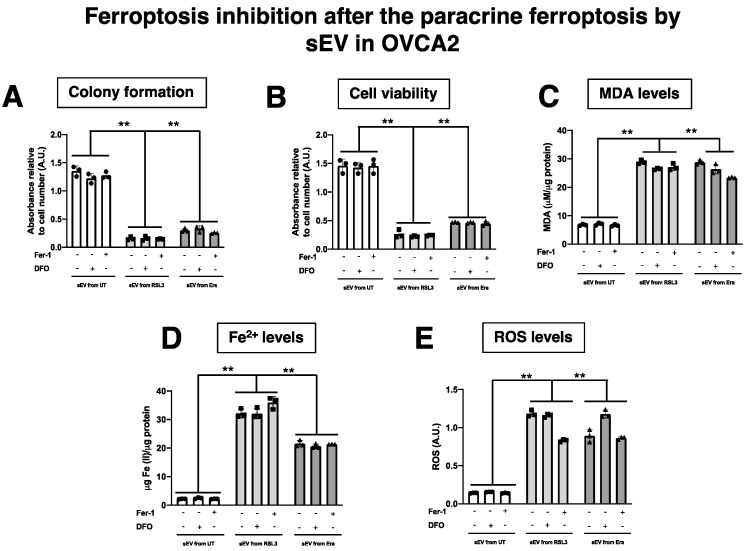
Figure A6.
Determination inhibition after the ferroptosis paracrine transmission by sEV in OVCAc. (A) Histogram of colony formation using crystal violet assay and (B) Histogram of cell viability using MTT assay in OVCAc treated with sEV from F-OVCAc for 6 days and with/without ferroptotic inhibitors (Ferrostatin-1 (Fer-1) and Deferoxamine (DFO)) for 6 days in OVCA2; (C) Histogram of Malondialdehyde (MDA) levels in OVCAc treated with sEV from F-OVCAc for 6 days and with/without ferroptotic inhibitors (Fer-1 and DFO) for 6 days in OVCA2; (D) Histogram of Iron (II) (Fe2+) levels in OVCAc treated with sEV from F-OVCAc for 6 days and with/without ferroptotic inhibitors (Fer-1 and DFO) for 6 days in OVCA2; (E) Histogram of reactive oxygen species (ROS) levels in OVCAc treated with sEV from F-OVCAc for 6 days and with/without ferroptotic inhibitors (Fer-1 and DFO) for 6 days in OVCA2. The graphs show the mean ± SD of three independent experiments. ** p < 0.01. Related to Figure 12.

