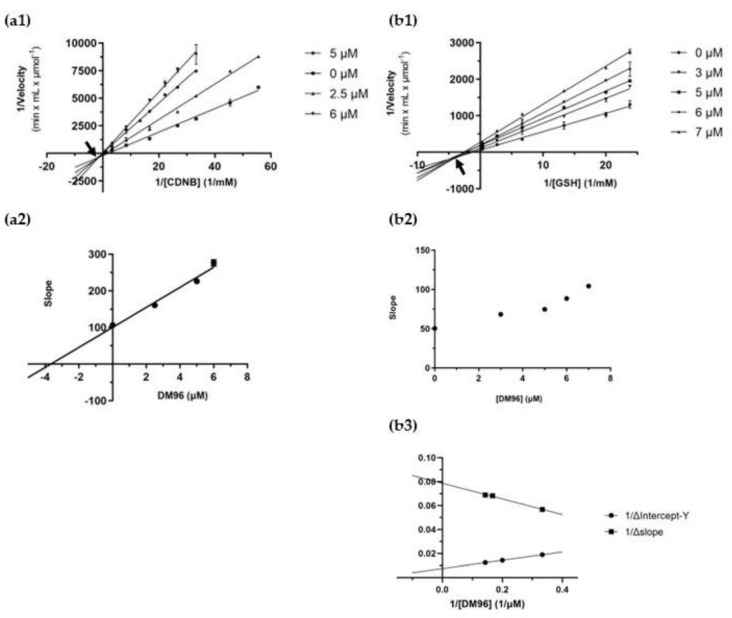
Figure 3.
Kinetic inhibition studies. (a1) Lineweaver–Burk plot of the inhibition of hGSTP1-1 isoenzyme using CDNB as a variable substrate (18–980 μΜ) at different constant concentrations of DM96 (0, 2.5, 5, and 6 μM). (a2) Secondary plot of the slopes of each Lineweaver–Burk line as a function of DM96 concentration. (b1) Lineweaver–Burk plot of the inhibition of hGSTP1-1 isoenzyme using GSH as a variable substrate (37.5–3750 μΜ) at different constant concentrations of DM96 (0, 3, 5, 6, and 7 μM). (b2) Secondary plot of the slopes of each Lineweaver–Burk line as a function of DM96 concentration. (b3) Tertiary plot depicting the 1/ΔIntercept -Y and 1/Δslope as a function of the 1/[inhibitor].

