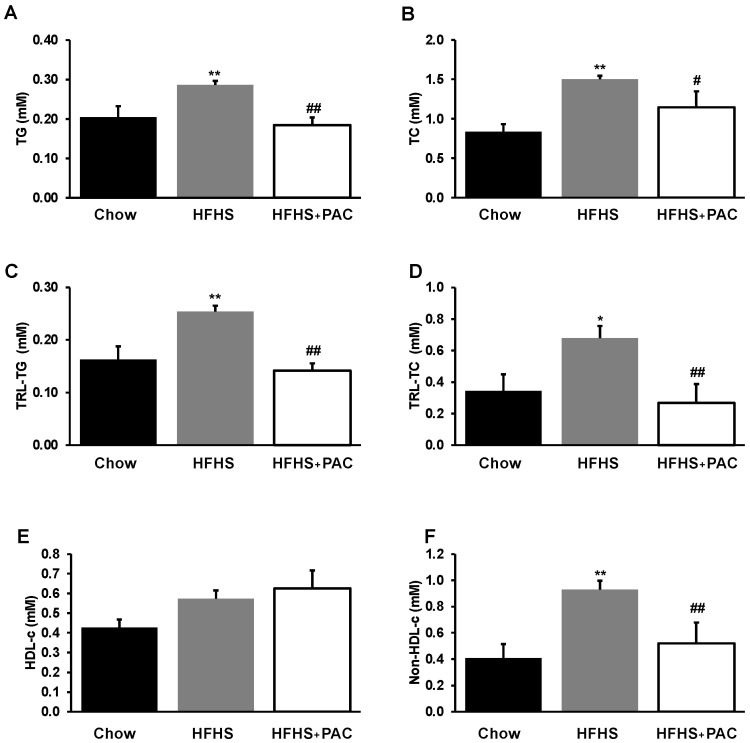
Figure 3.
Effect of PAC on dyslipidemia and lipoprotein composition. After 12 weeks diet and before sacrifice, plasma was collected for lipid profile determination. (A) triglycerides (TG), (B) total cholesterol (TC) as well as (C) TG, (D) TC in triglyceride-rich lipoprotein fractions (TRL) content, (E) HDL-cholesterol and (F) non-HDL-cholesterol were analyzed as described in Materials and Methods. Results are presented as mean ± SEM for n = 4–6 pooled plasma/group. * p < 0.05, ** p < 0.01 vs. chows; # p < 0.05, ## p < 0.01 vs. HFHS mice.

