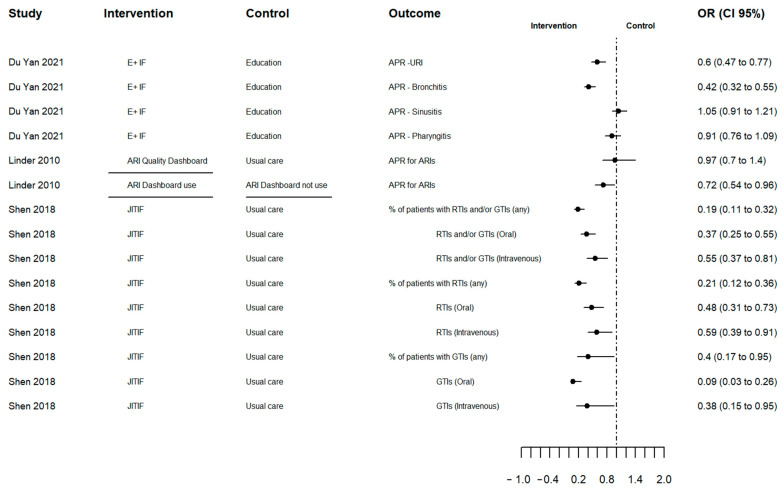
Figure 2.
Forest plot of antibiotic prescribing change outcome in odd ratios. Source: elaborated by the authors with information reported of studies included. E+F: Education plus individualized prescribing feedback dashboard; ARI: Acute Respiratory Infection; ARI Quality Dashboard Use (line segment): intervention physicians who used the ARI Quality Dashboard at least once versus intervention clinicians who did not use it; JITIF: Just-in-Time Information and Feedback; APR: Antibiotic prescription rate; URI: Upper respiratory infection; RTIs: Respiratory tract infections; GTIs: Gastrointestinal tract infections; OR: Odd ratio; CI: confidence interval.

