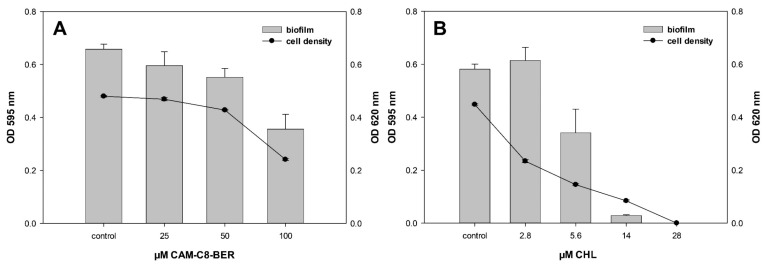
Figure 6.
Biofilm formation of E. coli at different concentrations of CAM-C8-BER (A) and CHL (B). E. coli WT cells were exposed 20 h with the test compounds, and their cell density (black curves) and surface attachment (gray bars) were measured. Values for cell density (OD620) are indicated on the right y-axis, and biofilm values (OD595) are indicated on the left y-axis.

