Figure 2.
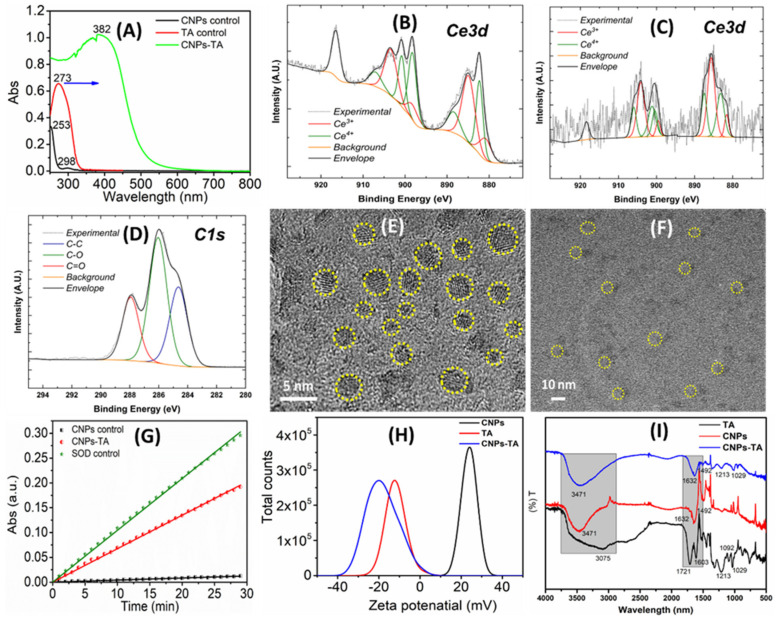
Shows various materials characterization techniques subjected to tannic acid (TA) molecules conjugated with cerium oxide nanoparticles (CNPs) by the bioconjugation process at room temperature. (A) UV−Vis spectrum of control CNPs (peaks at 253 and 298 nm), TA (peak at 273 nm), and CNPs−TA (peak at 382 nm). (B–D) X−ray photoelectron spectroscopy (XPS) spectrum of control CNPs, TA, and CNPs−TA. (E,F) High-resolution transmission electron microscopy (HR−TEM) images of control CNPs and CNPs−TA. (G) Superoxide dismutase (SOD) activity of CNPs−TA compared with control SOD and CNPs. (H) The zeta potential of pure and conjugated samples. The zeta potential of control CNPs showed 23 ± 2 mV, which changed to −19 ± 2 mV after conjugation of the TA molecule. (I) FTIR spectrum of TA, CNPs and CNP-TA samples.

