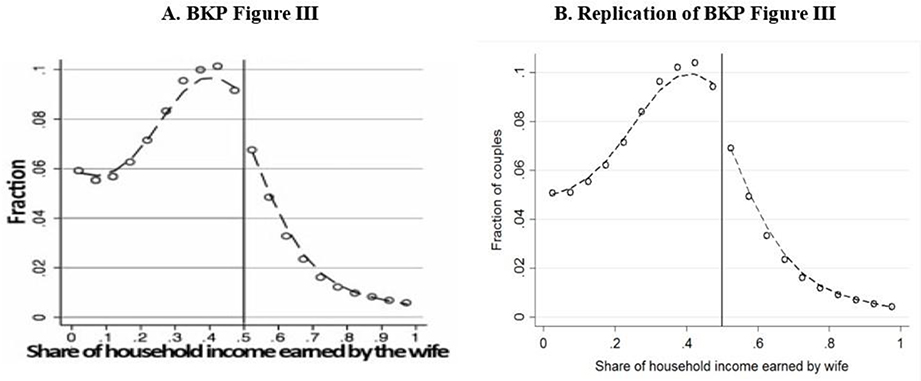
Figure 1. Distributions of Gender Relative Income in the 2000 U.S. Census.
Notes: Graph A is a screenshot of Figure III of Bertrand, Kamenica and Pan (2015). Graph B is our replication. Each graph is based on a sample of dual-earning married couples in which both husband and wife are between 18 and 65 years of age. Each graph plots a 20-bin histogram of the distribution, across couples, of the share of total household income that was earned by the wife. The dashed lines depict the lowess smoother applied to each histogram, allowing for a break at 0.5.

