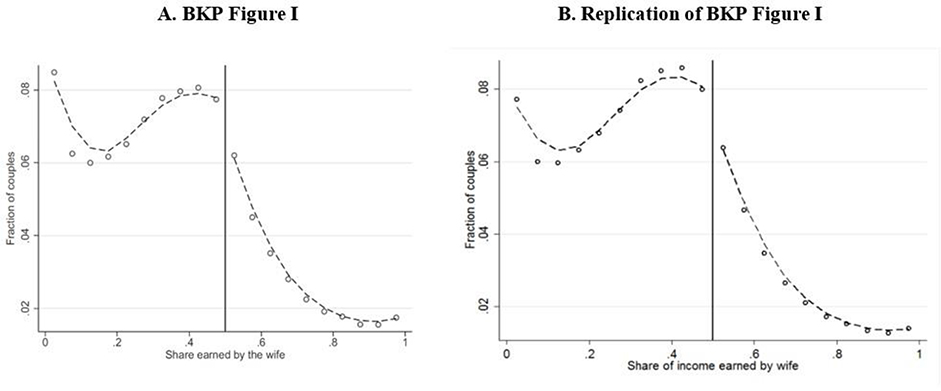
Figure 6. Distributions of Gender Relative Income in U.S. Administrative Record Sample.
Notes: Graph A is a screenshot of Figure I of Bertrand, Kamenica and Pan (2015). The data underlying this graph are administrative income data from the SIPP-SSA Gold Standard File covering the 1990 to 2004 SIPP panels. Graph B is our replication. We use the latest version of the Gold Standard File, which includes the 1984 and 2008 SIPP panels as well. The sample in each graph includes all dual-earning couples aged 18 to 65, with income information taken from the first year the couple was observed in the SIPP panel. See Section V for further discussion. Each graph plots 20-bin histograms of the observed distribution of the wife’s share of total spousal earnings. The dashed lines represent the lowess smoother applied to each histogram on either side of 0.5.

