
Figure 7.
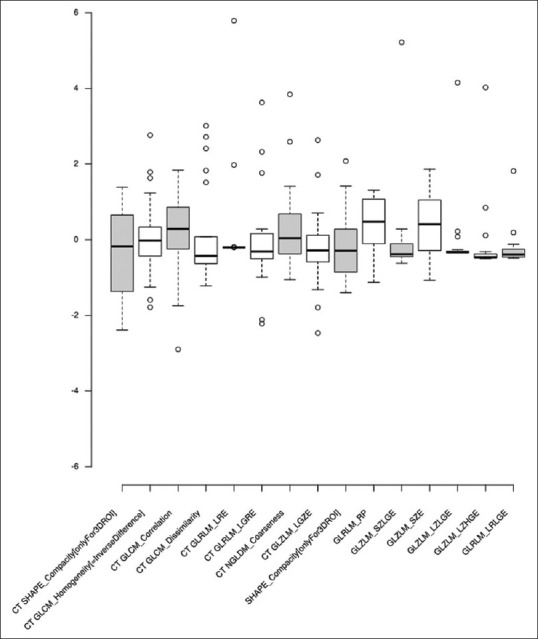
Boxplot of the metastases group standardized computed tomography and positron-emission tomography parameter values used in models in both approaches yielding the highest area under the curve values
Official websites use .gov
A
.gov website belongs to an official
government organization in the United States.
Secure .gov websites use HTTPS
A lock (
) or https:// means you've safely
connected to the .gov website. Share sensitive
information only on official, secure websites.
Boxplot of the metastases group standardized computed tomography and positron-emission tomography parameter values used in models in both approaches yielding the highest area under the curve values