Fig. 4.
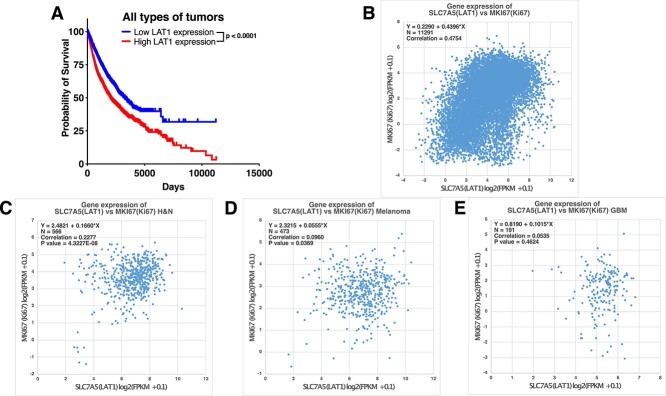
Correlation between high LAT1 expression in tumor tissues and poor prognosis. (A) Survival curves of patients with cancer in TCGA stratified according to LAT1 expression. (B) Two-dimensional plots of SLC7A5 (LAT1) and MKI67 (Ki67) in all types of tumors. (C) Two-dimensional plots of SLC7A5 (LAT1) and MKI67 (Ki67) in patients with head and neck cancer (H&N). (D) Two-dimensional plots of SLC7A5 (LAT1) and MKI67 (Ki67) in patients with melanoma. (E) Two-dimensional plots of SLC7A5 (LAT1) and MKI67 (Ki67) in patients with glioblastoma (GBM). FPKM, the value of fragments per kilobase million.

