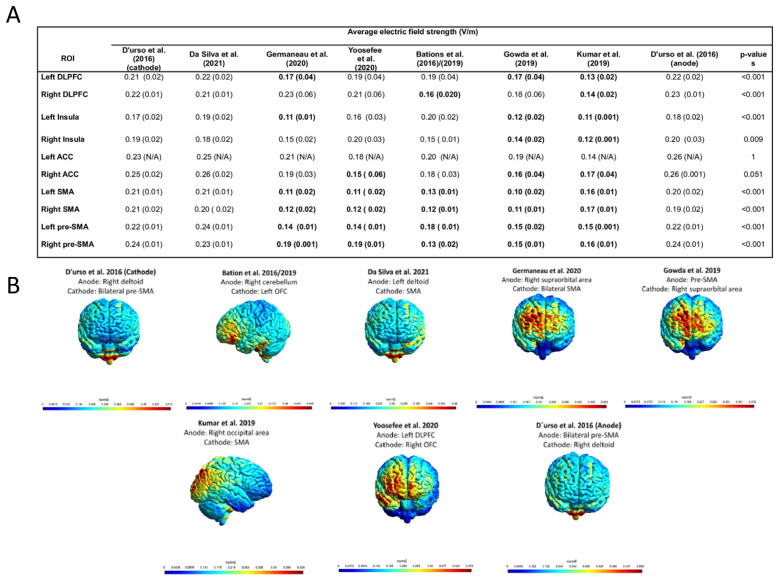
Figure 3.
Electric field modeling analysis [19,20,21,22,23,24,25,26]. (A) Mean and standard deviation of electric field strength of montages across different brain regions of interest. (B) Electric field distribution based on the different montages used. Note: For this analysis, we used the D’Urso et al. study (cathode) as reference, as this montage has already been found to produce stronger EFs in regions of interest for OCD [41,42]. A higher mean represents a stronger EF in the regions of interest. Results displayed in bold font represent significance in comparison to D’Urso et al., 2016 (cathode). Therefore, Da Silva et al., 2021 [22] and D’Urso et al., 2006 (anode) [23] did not show any EF strength differences in comparison to the reference montage. Abbreviation: ACC—anterior cingulate cortex; N/A—not applicable (For the left ACC analysis, the electric field modeling was able to quantify only one subregion. Therefore, no standard deviation is presented.); ROI—region of interest; SMA—supplementary motor area. p-values represent the linear regression results. p-values ≤ 0.05 were considered significant.

