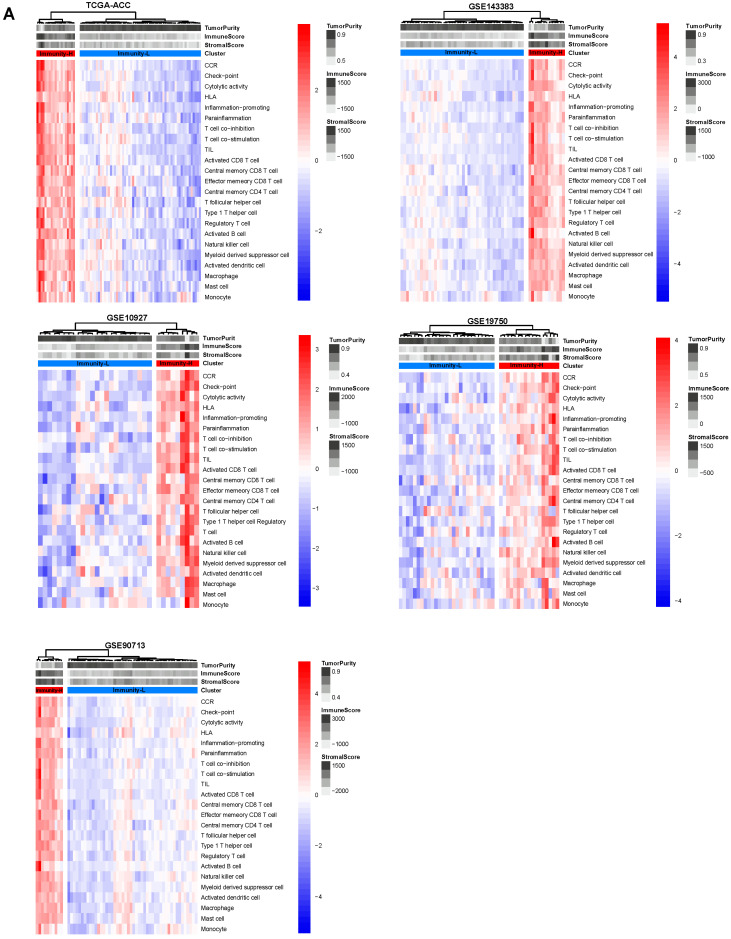
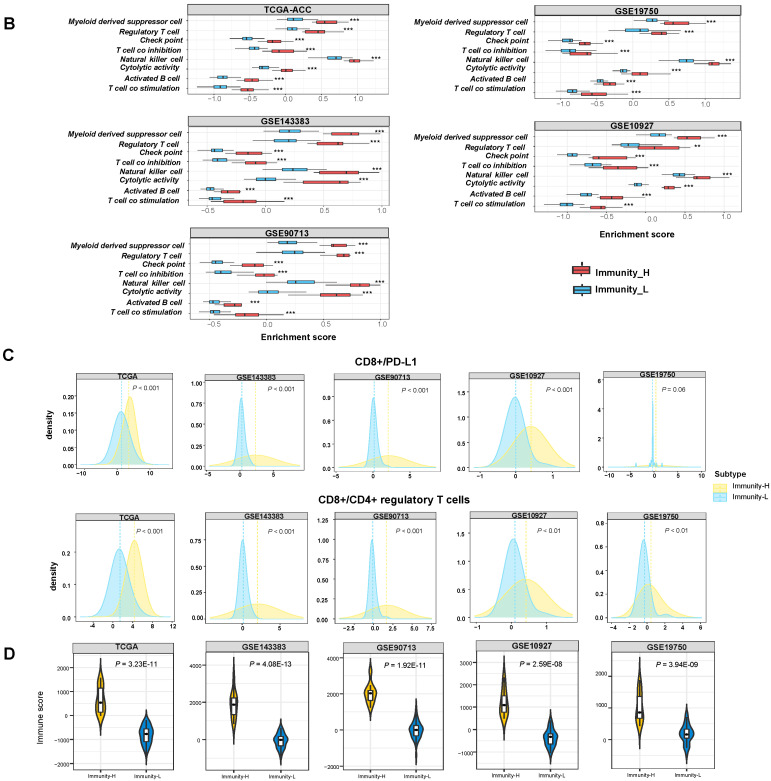
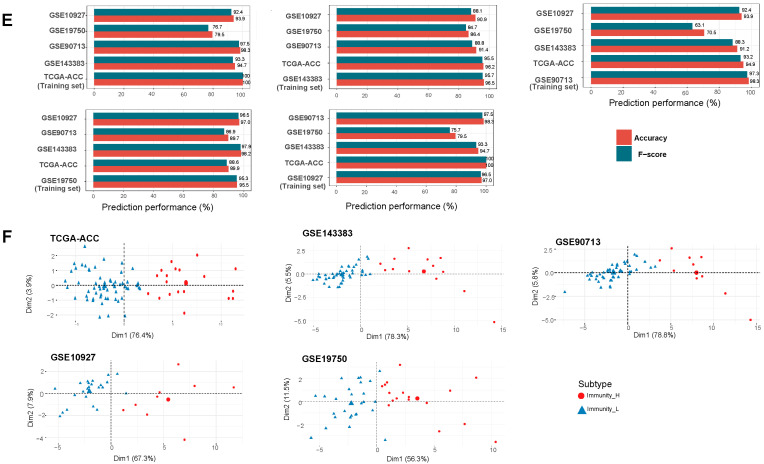
Figure 1.
Hierarchical clustering of ACC tumors based on the enrichment of 23 immune signatures. (A) Clustering analyses uncovering two immune subtypes of ACC: Immunity-H and Immunity-L, which have high and low immune cell enrichment scores, respectively, consistently in five datasets. Comparisons of the enrichment scores of immunostimulatory signatures (T cell co-stimulation, activated B cell, cytolytic activity, and natural killer cell) and immunosuppressive signatures (T cell co-inhibition, immune checkpoint molecules, regulatory T cells, and myeloid-derived suppressor cells). (B) Ratios of immunostimulatory to immunosuppressive signatures (CD8+/PD-L1, CD8+/CD4+ regulatory T cells) between the two immune subtypes. (C) Immune scores evaluated by ESTIMATE [7]. (D) One-tailed Mann–Whitney U test (B,D) and Student’s t test (C) p-values are shown. ** p < 0.01, *** p < 0.001. It also applies to the following figures. (E) Prediction of the three immune subtypes of ACC by Random Forest based on the enrichment scores of 23 immune cell types. The 10-fold cross-validation results in the training set and prediction results in the other datasets are shown. (F) PCA confirms that ACCs can be clearly separated into two subgroups based on the ssGSEA scores of the immune signatures.


