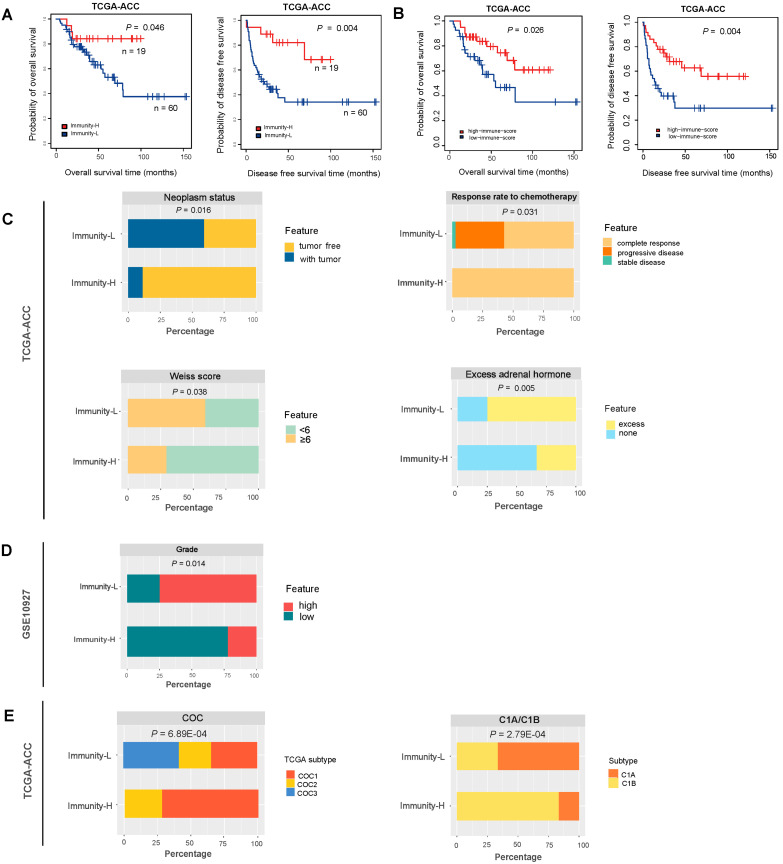
Figure 2.
Comparisons of clinical outcomes between two immune subtypes of ACC. (A) Comparisons of overall survival (OS) and disease-free survival (DFS) rates between the immune subtypes by Kaplan–Meier curves. The log-rank test p-values are shown. (B) Comparisons of OS and DFS between high immune score (>median) and low immune score (<median). Comparisons of neoplasm status, the response rate to chemotherapy, Weiss score, and excess adrenal hormones, between the two immune subtypes in TCGA-ACC (C), and comparisons of grade between two immune subtypes in GSE10927 (D). The overlap between immune subtypes and CoC or C1A/C1B subtypes (E). The Fisher’s exact test p-values are shown (C–E).

