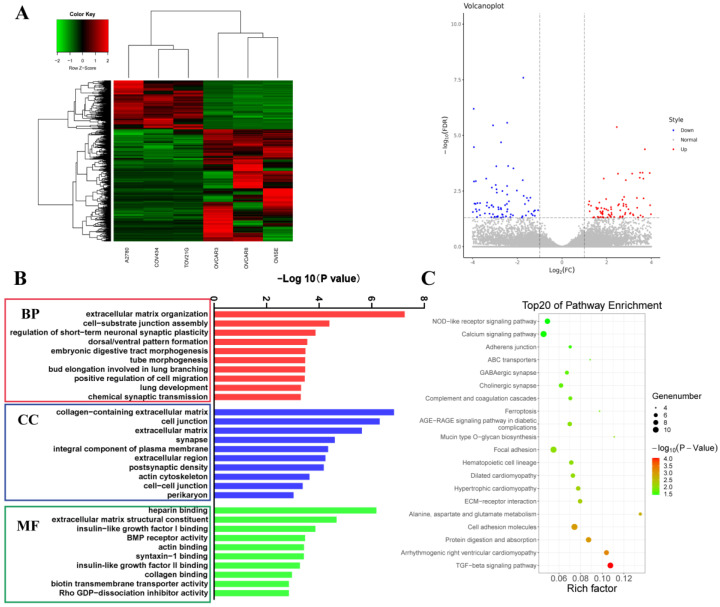
Figure 3.
Identification and functional analysis of the differentially expressed genes. (A): Heat map and volcano plot of the differentially expressed genes (DEGs) among diploid cell lines versus aneuploid cell lines. (B): Gene Ontology summary of DEGs for biological process categories (BP), cell component categories (CC) and molecular function categories (MF). (C): Kyoto Encyclopedia of Genes and Genomes summary of DEGs.

