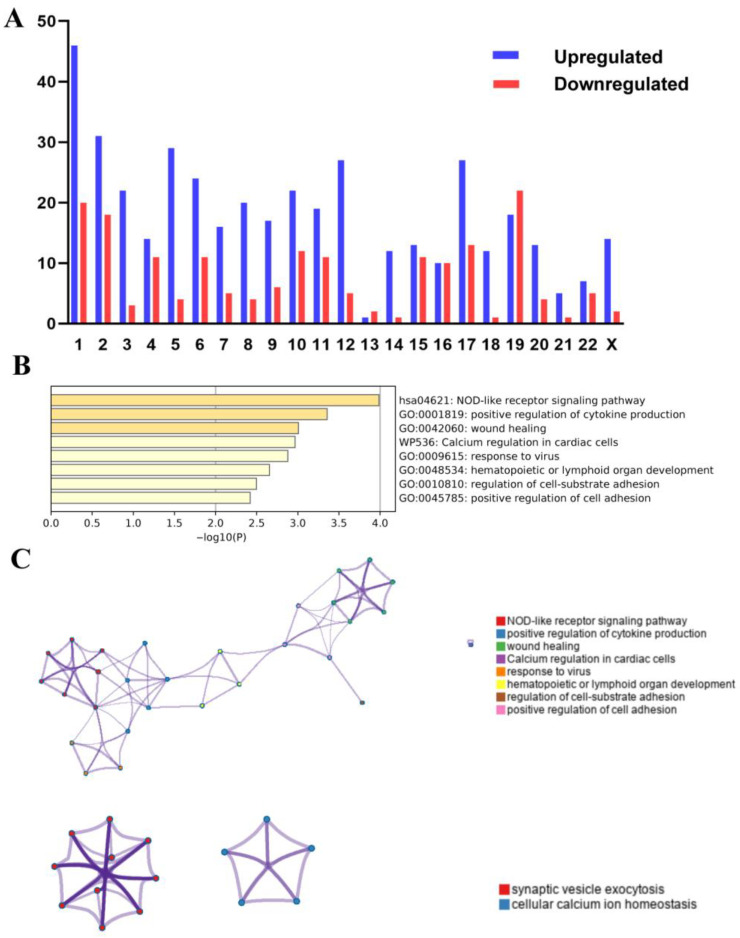
Figure 5.
Location of differentially expressed genes and their functional analysis. (A): The enrichment of chromosomes using 419 upregulated DEGs and 182 downregulated DEGs in aneuploid cell lines. (B): Enrichment using the 46 upregulated DEGs on chromosome 1. (C): Enrichment using the 46 upregulated DEGs on chromosome 1 (left) and the 22 downregulated DEGs on chromosome 19 (right).

