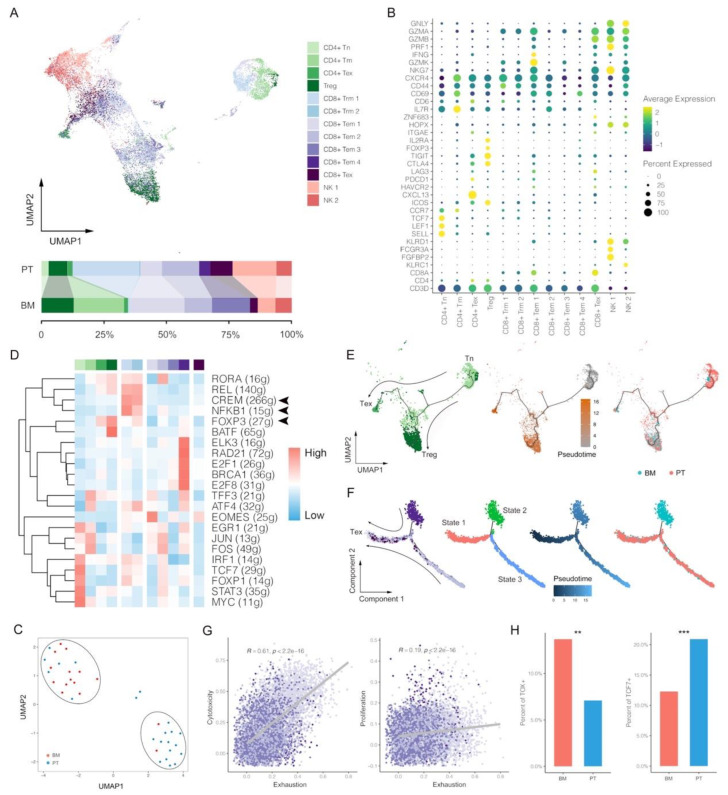
Figure 2.
Single-cell characterization of T/natural killer (NK) cells in primary tumors (PT) and brain metastases (BM) of lung adenocarcinomas. (A) UMAP plot and proportions of T/NK clusters. (B) Average expression and cell precent expressed of marker genes in each T/NK cluster. (C) Clustering of T/NK proportion features between PT and BM groups. (D) Normalized activations of transcription factors in each T/NK clusters. The number of predicted target genes for each transcription factor was shown in the latter brackets. (E,F) Pseudotime trajectory analysis of CD4+ and CD8+ T lymphocytes. (G) Correlations between exhaustion and cytotoxicity/proliferation scores of CD8+ Tem. (H) Proportions of TOX+ or TCF7+ cells in CD8+ Tem between BM and PT (Chi-square test; ** p value < 0.01, *** p value < 0.001). CD4+ naïve T cell (CD4+ Tn), CD4+ memory T cell (CD4+ Tm), CD4+ exhausted T cell (CD4+ Tex), Treg, CD8+ tissue-resident memory T cell (CD8+ Trm), CD8+ effector memory T cell (CD8+ Tem), CD8+ exhausted T cell (CD8+ Tex).

