Figure 3.
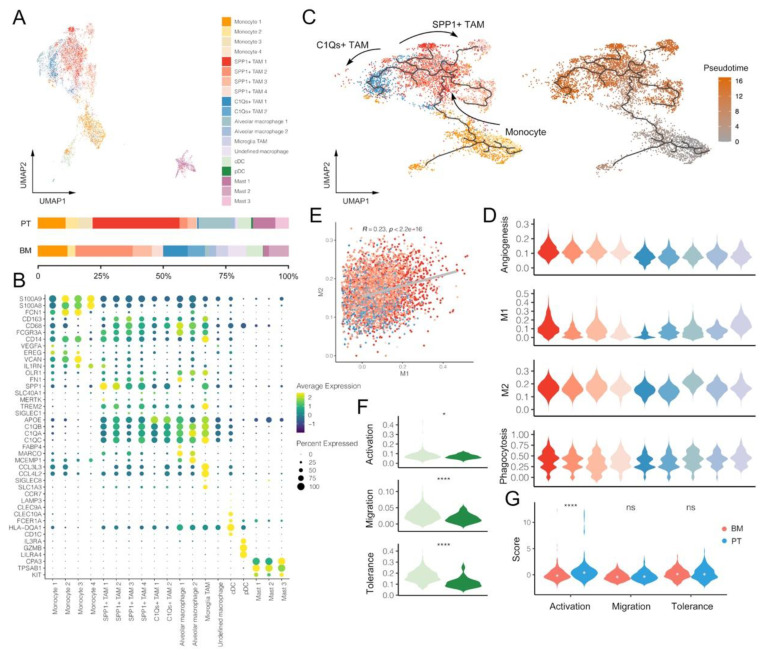
Single-cell characterization of myeloid cells in primary tumors (PT) and brain metastases (BM) of lung adenocarcinomas. (A) UMAP plot and proportions of myeloid cell clusters. (B) Average expression and cell precent expressed of marker genes in each myeloid cell cluster. (C) Pseudotime trajectory analysis of monocytes and TAMs. (D) Signature scores of gene sets associated with M1, M2, angiogenesis and phagocytosis in each TAM cluster. (E) Correlation between M1 and M2 scores of TAMs (Pearson correlation). (F) Signature scores of gene sets associated with activation, migration and tolerance between cDC and pDC (Wilcox rank-sum test; * p value < 0.05, **** p value < 0.0001). (G) Comparison of DC activation, migration and tolerance scores between PT and BM groups (Wilcox rank-sum test; **** p value < 0.0001). Tumor-associated macrophages (TAM).

