Figure 4.
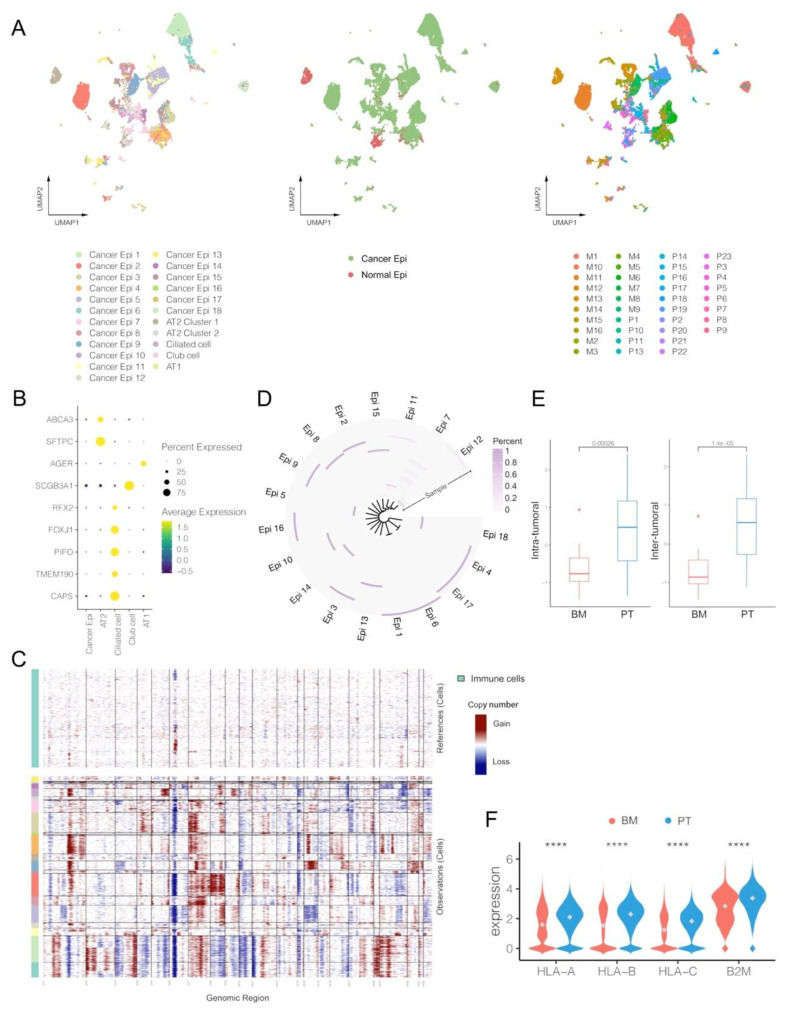
Single-cell characterization of epithelial cells in primary tumors (PT) and brain metastases (BM) of lung adenocarcinomas. (A) UMAP plot of epithelial cells by clusters, by cancer vs. normal epithelial, and by patients (M: brain metastasis; P: primary tumor). (B) Average expression and cell precent expressed of marker genes in each normal epithelial cluster. (C) Estimation of copy number alterations (CNAs) in each cluster of cancer epithelial cells by inferCNV (immune cells were set as references). (D) Proportions of cancer epithelial cells originating from each tumor sample in each cancer clusters. (E) Comparisons of intra-tumoral and inter-tumoral heterogeneity between PT and BM tumors. (F) Expression levels of HLA-I genes between cancer epithelial cells of BM and PT groups (Wilcox rank-sum test, **** p value < 0.0001). Alveolar type 1 cells (AT1); Alveolar type 2 cells (AT2).

