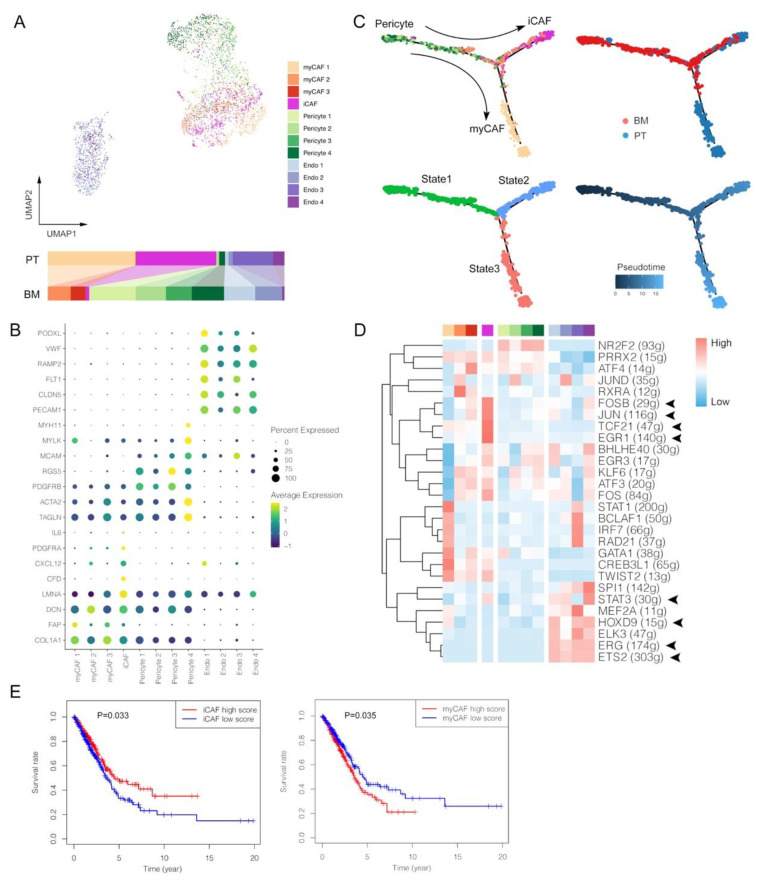
Figure 5.
Single-cell characterization of stromal cells in primary tumors (PT) and brain metastases (BM) of lung adenocarcinomas. (A) UMAP plot of stromal cells. (B) Average expression and cell precent expressed of marker genes in each stromal cell cluster. (C) Pseudotime trajectory analysis of pericytes and CAFs. (D) Normalized activations of transcription factors in each stromal cell cluster. The number of predicted target genes for each transcription factor was shown in the latter brackets. (E) Kaplan–Meier survival curves of iCAF and myCAF signatures in patients with lung adenocarcinomas originating from The Cancer Genome Atlas (TCGA) Program. Inflammatory-like cancer-associated fibroblasts (iCAF); myofibroblast CAF (myCAF); endothelial cells (Endo).

