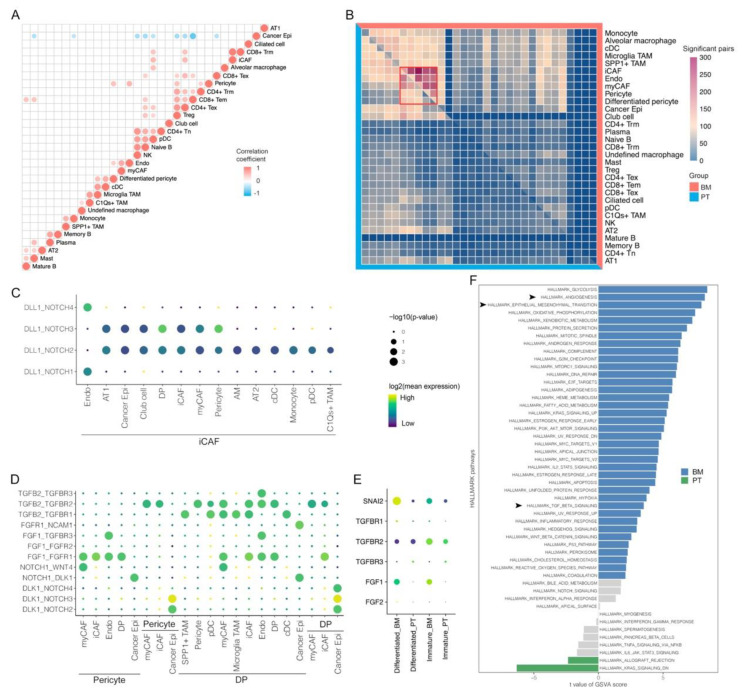
Figure 6.
Specific cell-cell interactions in primary tumors (PT) and brain metastases (BM) of lung adenocarcinomas. (A) Correlations of cell proportions for each non-epithelial cluster in each tumor sample (Pearson correlation). (B) Comparisons of significant cell-cell interactions between BM and PT tumors. (C) Significant interaction pairs specifically in PT groups. (D) Significant interaction pairs specifically in BM groups. (E) Specific gene expressions in differentiated and immature pericytes between BM and PT tumors. (F) Activation differences of pathways for pericytes between BM and PT tumors by GSVA analysis. Differentiated pericytes (DP).

