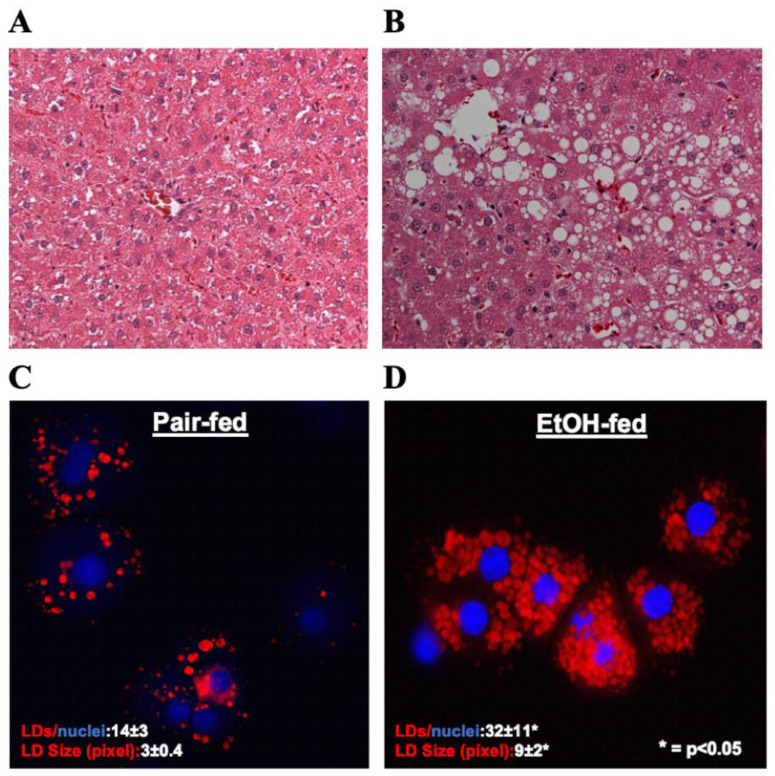
Figure 1.
(A&B) Hematoxylin and Eosin staining was performed on paraffin sections of control and EtOH-fed rat livers. Images are representative of each group. Magnification, 200×. (C&D) Oil red O staining of LDs in hepatocytes isolated from control and EtOH-fed rat livers. Images are representative of each group.

