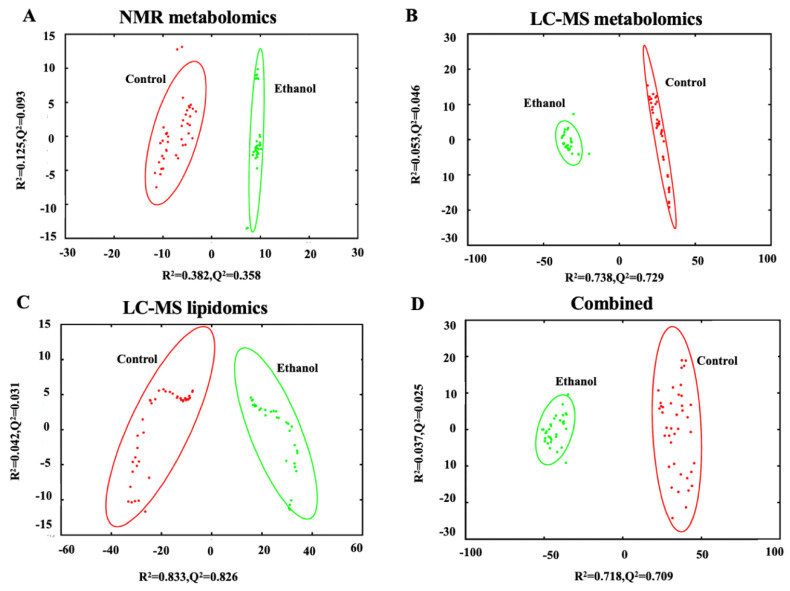
Figure 2.
PCA scores plot generated from (A) 1D 1H NMR metabolomics data set (R2 0.507, Q2 0.451), (B) LC-MS metabolomics data set (R2 0.791, Q2 0.775), (C) LC-MS lipidomics data set (R2 0.875, Q2 0.857), and (D) the combined omics data set (R2 0.755, Q2 0.734) comparing control (red) to ethanol (green) treatment of rat hepatocytes. The ellipses represent a 95% confidence limit of the normal distribution of each cluster.

