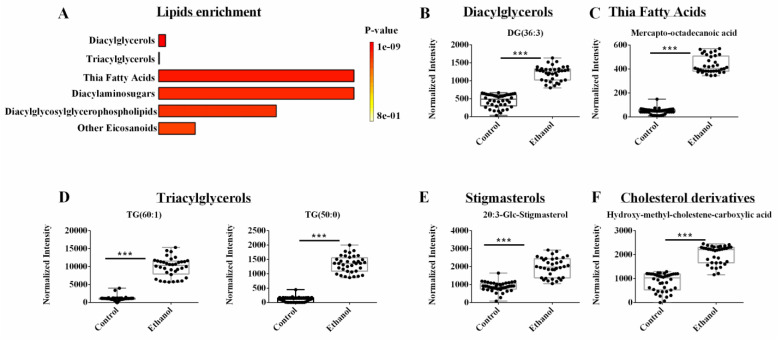
Figure 5.
(A) An enrichment analysis of the 39 lipids from the LC-MS lipidomics data set with a statistically significant change in hepatocyte cells following ethanol exposure. (B–F) Representative box plots of lipids from the top enriched pathways in (A) that highlight the top lipid changes in the lipidomics data sets. All the metabolites demonstrated a fold change > 2.0 and an FDR p-value < 0.001 using the Benjamini-Hochberg method. Compound class and names are listed above the box plots. *** p-value < 0.001.

