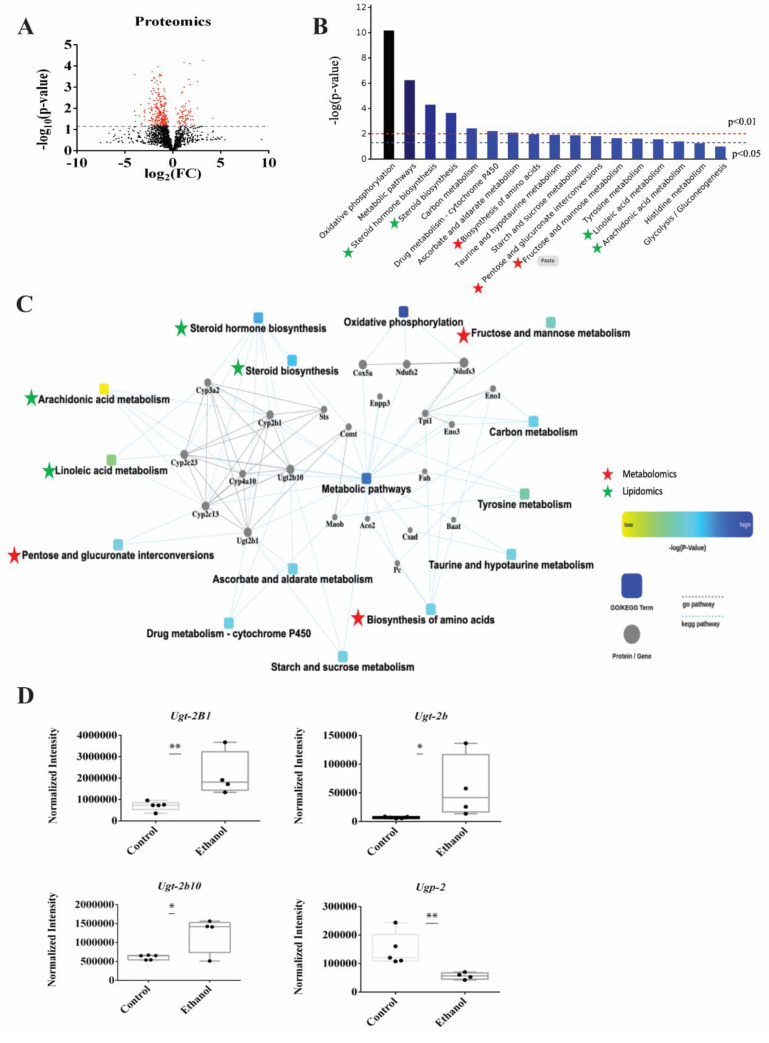
Figure 6.
(A) A volcano plot summarizing the LC-MS proteomics data set. The dashed line identifies the p-value of 0.05. All proteins above the p-value threshold are colored red. A total of 2083 proteins were detected with 368 proteins differentially expressed (p-value < 0.05). (B) A protein enrichment analysis based on the 124 differentially expressed proteins showing the most impactful 17 Kyoto Encyclopedia of Genes and Genomes (KEGG) pathways. The pathways common to both the metabolomics and proteomics data sets or both the lipidomics and proteomics data sets are marked with red and green stars, respectively. (C) A Cytoscape generated protein–protein interaction (PPI) network of the significantly changing (p-value < 0.05) KEGG pathways. The pathways common to both the metabolomics and proteomics data sets or both the lipidomics and proteomics data sets are marked with red and green stars, respectively. (D) Box plots of the UDP-glucuronosyltransferases (UGTs) proteins that are part of the glucuronidation pathway. * p-value < 0.05, ** p-value < 0.01.

