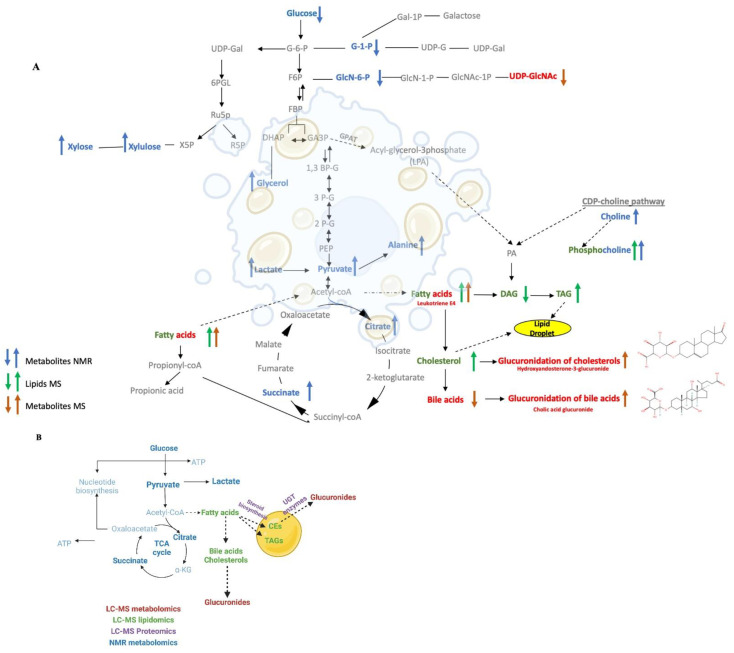
Figure 7.
(A) A schematic diagram of the metabolic and lipidomic network created from the integrated metabolomics and lipidomics data sets. The network map summarizes the consensus changes in the hepatocyte lipidome (green), NMR detected metabolome (blue), and LC-MS detected metabolome (red) resulting from ethanol exposure. An up arrow indicates a relative increase and a down arrow indicates a relative decrease due to ethanol exposure. (B) A summary network map combining the outcomes from the lipidomics, metabolomics and proteomics data set. The network map summarizes the consensus changes in the lipid drop proteins (purple), and the hepatocyte lipids (green), NMR detected metabolome (blue), and LC-MS detected metabolome (red) resulting from ethanol exposure.

