
Figure 3.
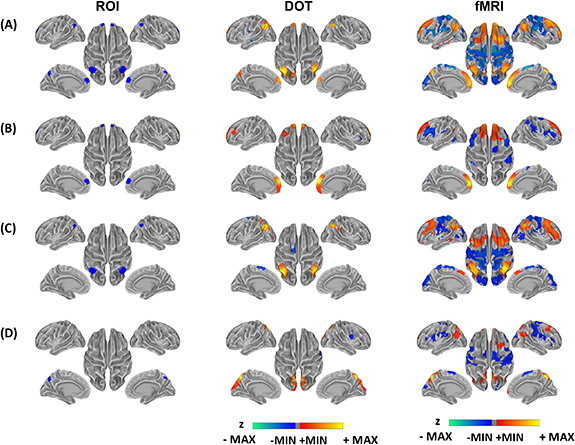
Resting state functional connectivity by fNIRS HbR and fMRI. Connectivity maps are based on seeds of (A) a compound seed (the average of mPFC, IPL and precuneus) (B) mPFC, (C) IPL and (D) precuneus. All maps are thresholded according to q < 0.05 after multiple comparison correction. Walm colors from red to yellow indicate the positive z values after thresholding. Cold colors from blue to green indicate the negative z values after thresholding. The threshdolded connectivity maps are overlaid on the standard cortical surface with grey colors indicating the curvature profile of the surface. mPFC: medial prefrontal cortex, IPL: inferor parietal lobules.