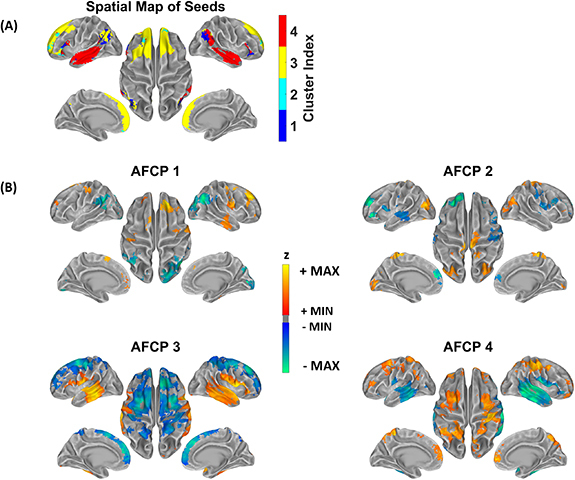
Figure 4.

Aliased functional connectivity patterns (AFCP) after down-sampling. (A) Four AFCPs are discovered and their associated seeds. At each seed, the AFCP which has the highest number of sessions in all differential functional connectivity maps was assigned. (B) Spatial distribution of each AFCP. All maps are thresholded according to q < 0.05 after multiple-comparison correction. Red–yellow colorbar indicates increase of functional connectivity after thresholding. Blue–green indicates decrease of functional connectivity caused by the insufficient sampling frequency, after thresholding. The thresholded connectivity maps are overlaid on the standard cortical surface with grey colors indicating the curvature profile of the surface.
