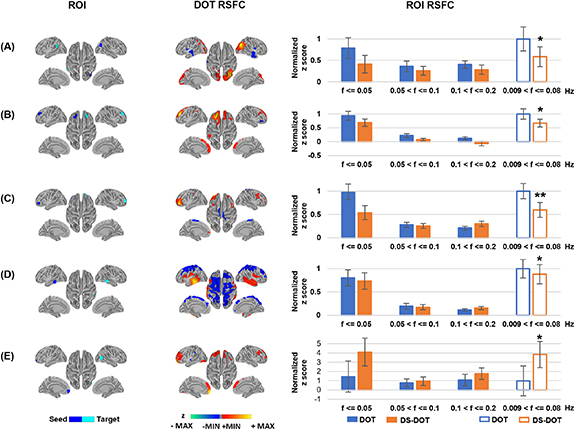
Figure 5.

Frequency contributions to resting state functional connectivity in ROIs. Rows (A)–(D) present representative seed and target regions selected to show a decrease in functional connectivity in HbR DOT due to aliasing effects. Row E presents representative seed and target regions to show an increase in functional connectivity in HbO DOT. In the maps of DOT RSFC, all connectivity values are thresholded according to q < 0.05 after multiple-comparison correction. Walm colors from red to yellow indicate the positive z values after thresholding. Cold colors from blue to green indicate the negative z values after thresholding. The thresholded connectivity maps are overlaid on the standard cortical surface with grey colors indicating the curvature profile of the surface. In the bar graphs of ROI RSFC, the connectivity values (mean and standard errors) are normalized to the mean connectivity of DOT in the range from 0.009 Hz to 0.08 Hz, per each ROI pair. * indicates a significant difference in the DS-DOT than the DOT, at p < 0.05. ** indicates a significant difference in DS-DOT than DOT, at p < 0.01.
