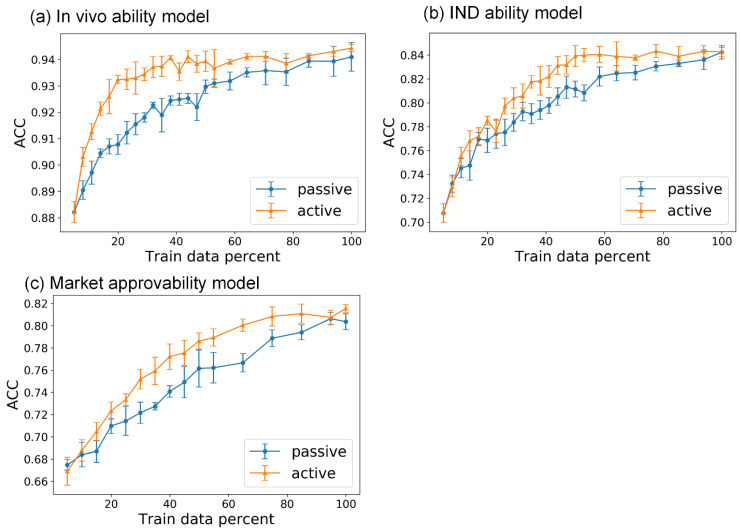
Figure 5.
The ACC of models in the active learning process on test sets versus the percentage of training data used. (a) In vivo ability model; (b) IND ability model; (c) market approvability model. The blue lines represent the performance of passive learning models, whereas the orange lines represent the performance of active learning models, and the error bar is the standard deviation of testing results in five-fold training.

