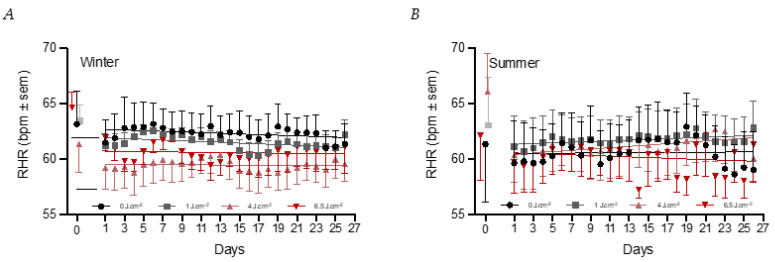
Figure 6.
Daily RHR during the four week period. The baseline values are shown on the left side. The black circles represent the 0 J·cm−2 condition (n = 7:6 for winter and summer), grey squares the 1 J·cm−2 condition (n = 7:7 for winter and summer), pink triangles the 4 J·cm–2 condition (n = 8:7 for winter and summer), and red triangles the 6 J·cm–2 condition (n = 8:6 for winter and summer). (A) shows the data in the winter group and (B) of the summer group.

