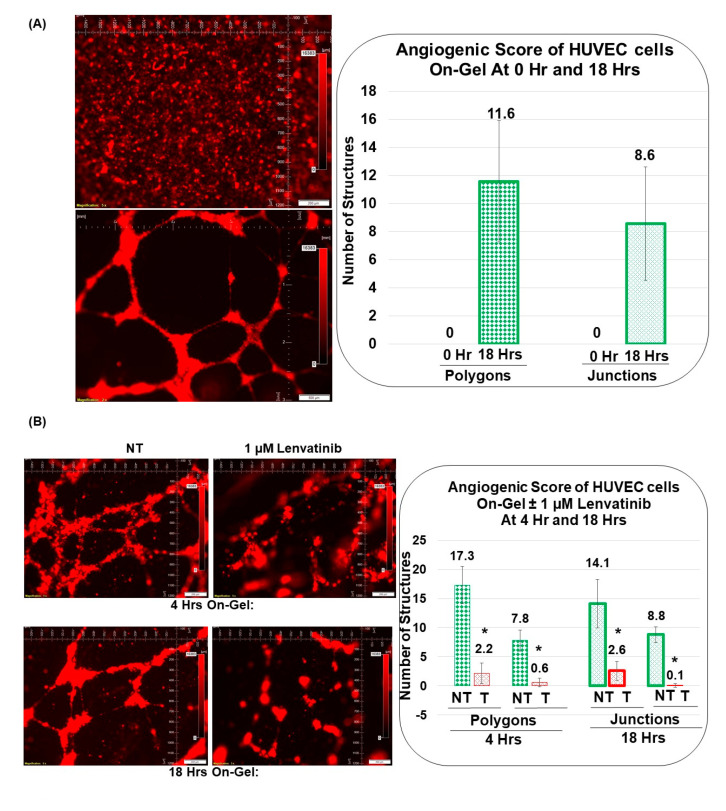
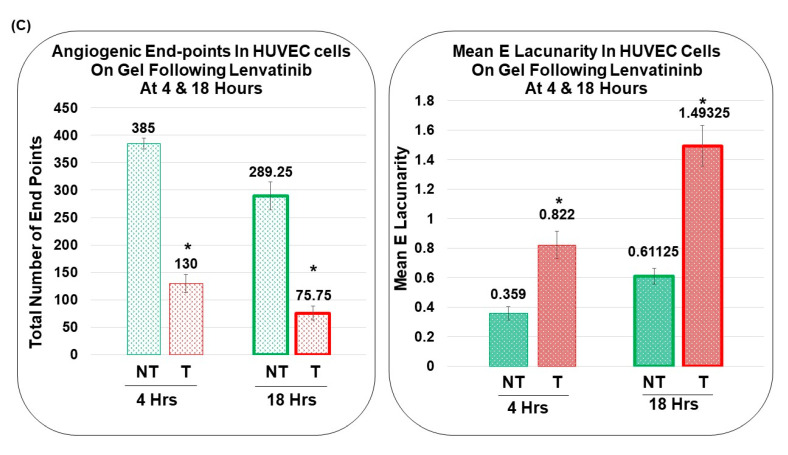
Figure 6.
Effect of Lenvatinib on cord formation of HUVEC cells on−gel: The effect of lenvatinib on the HUVEC cell cord formation on matrigel is tested at 0 h, 4 h, and 18 h. The angiogenic score of HUVEC cell on-gel cord formation at 0 h and 18 h (A) is measured by the number of polygons and junctions. Similarly, the effect of lenvatinib on the angiogenic score of HUVEC cell on-gel cord formation at 4 h and 18 h are measured by the number of polygons and junctions (B) as well as measuring angiogenic endpoints and mean E lacunarity (C). Matrigel tube formation assay of HUVECs cultured in control medium (green) or in the presence of 1 microM of lenvatinib (red) for 4 h (standard border of the width of bars) and 18 h (thicker border of the width of bars). Angiogenic Endpoints (total number) (represented in Divot bars) and the mean E lacunarity (represented in 40% filled bars) were detected with the AngioTool software (https://ccrod.cancer.gov/confluence/display/ROB2/Home; [accessed on 9 August 2022]). Bars represent the mean, and standard deviation of the mean; * p values are indicated for significant changes. Please note that the angiogenic endpoints in non-treated HUVEC cells showed a decreasing trend at 18 h as compared to 4 h. This is because the cord formation was dissolved and non-detected at later hours, after 24 h. However, the lacunarity of non-treated HUVEC cells showed an increasing trend at 18 h as compared to 4 h because the cells started to coalesce/aggregate as the cord formation started to dissolve. However, the total number of endpoints significantly decreased, and the lacunarity increased significantly following lenvatinib as compared to the respective controls at both 4 and 18 h, which matched with the pattern of decrease of the number of polygons and the junctions of the complete polygons. Being an automated assessment, AngioTool reduces subjectivity and the likelihood of human error and streamlines the analysis of features as compared to the manual evaluation, such as counting the number of complete polygons, endpoints, or numbers of junctions per image.


