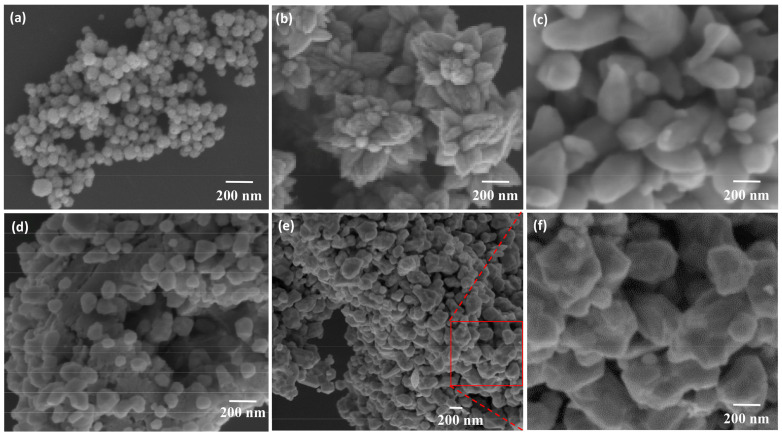
Figure 20.
SEM images of microscopic distribution on the sensing region in the synthesis process (a) Fe3O4, (b) ZnO, (c) ZnO/Fe3O4, (d) Ag/ZnO/Fe3O4 (e) Ag/ZnO/Fe3O4 (f) close up of (e). Reprinted with permission from Analytica Chimica Acta, Copyright 2019, Elsevier [128].

